Since joining Orbital Insight, I’ve become more and more interested in the amateur analysis of satellite imagery. While the team at Orbital is building all kinds of fancy computer vision-based methods for forecasting retail revenues, predicting world oil stockpiles, and measuring the extent of major floods, amateur geographers like myself can have lots of fun with publically available satellite imagery. Have you ever looked at an image like the one below and wondered who was behind those bright pixels in the middle of the Amazonian rainforest, or the Siberian tundra, or the New Guinean highlands?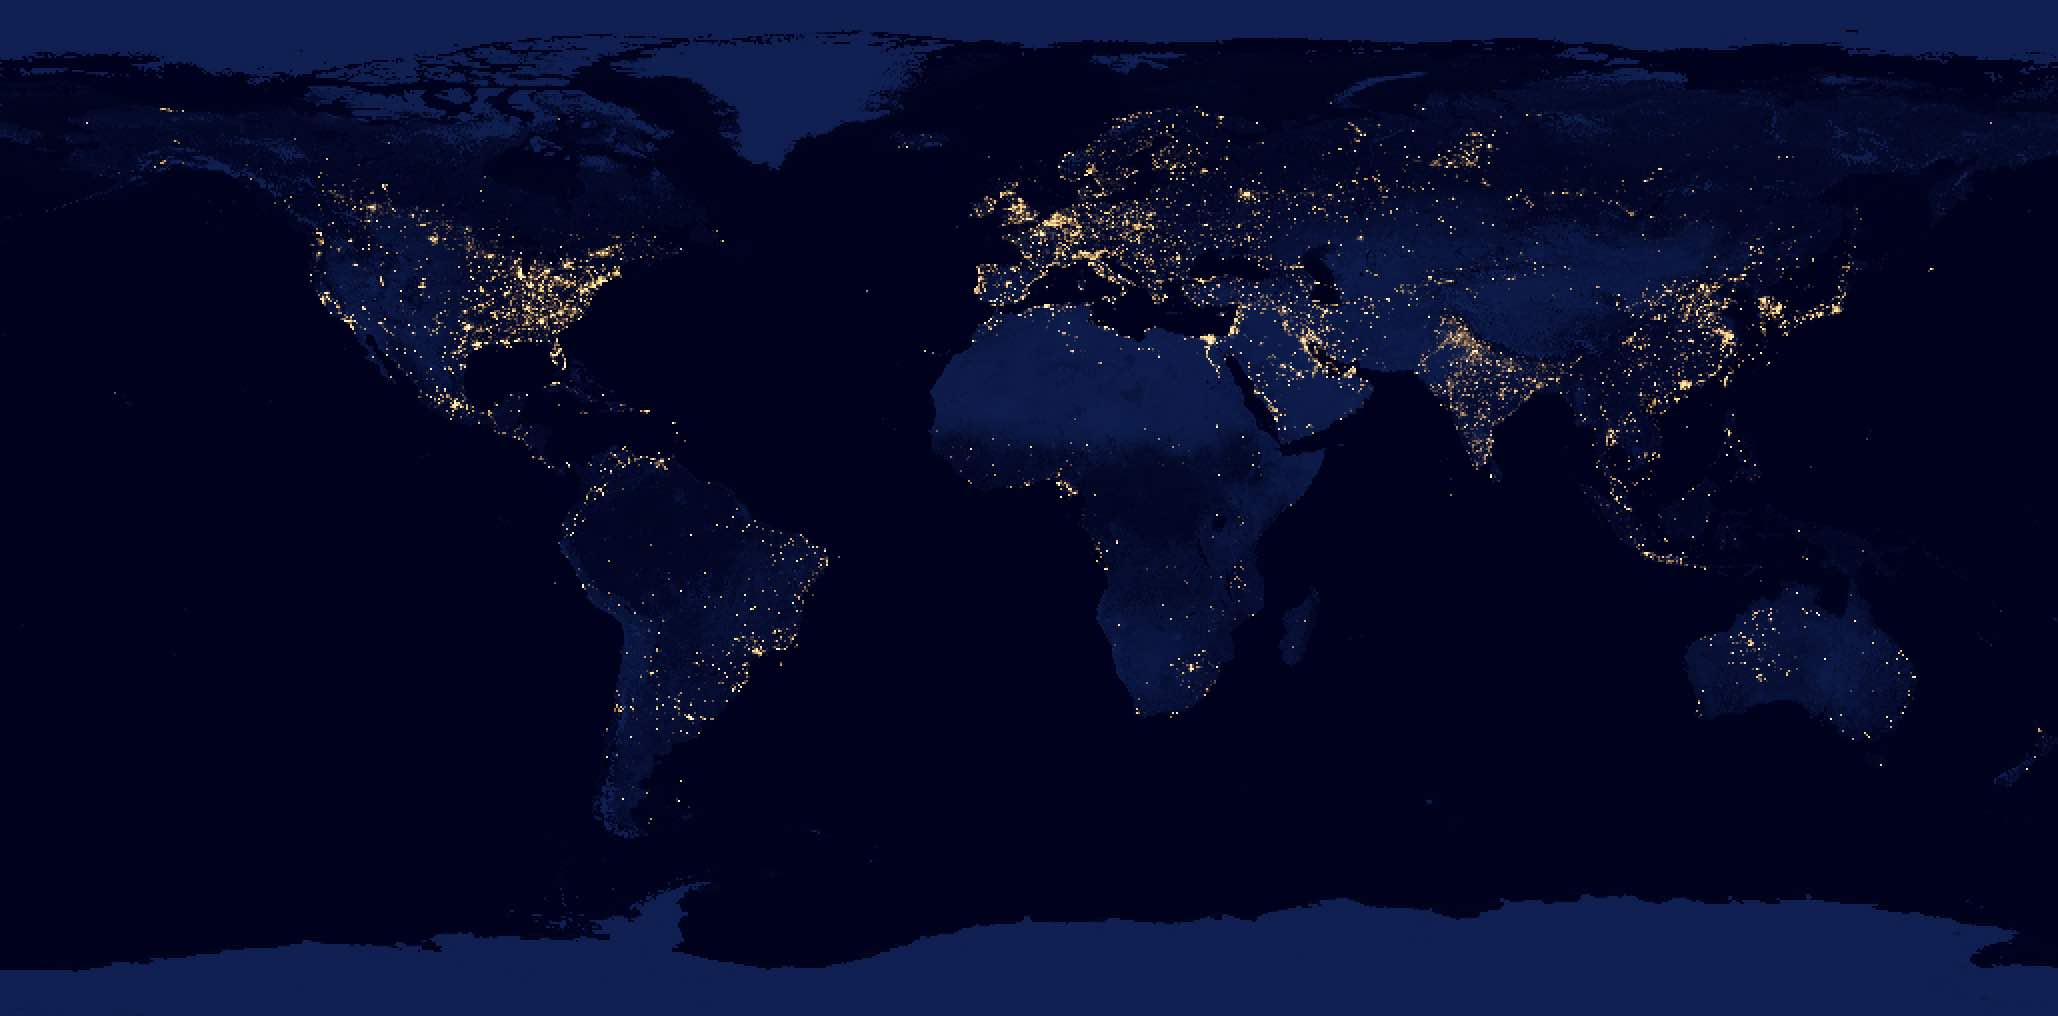
The world at night according to the Suomi National Polar-orbiting Partnership satellite, carrying Visible Infrared Imaging Radiometer Suite (VIIRSA). Over 312 orbits, this instrument collected day-night imagery of the earth to assemble a mosaic of human activity across the globe.
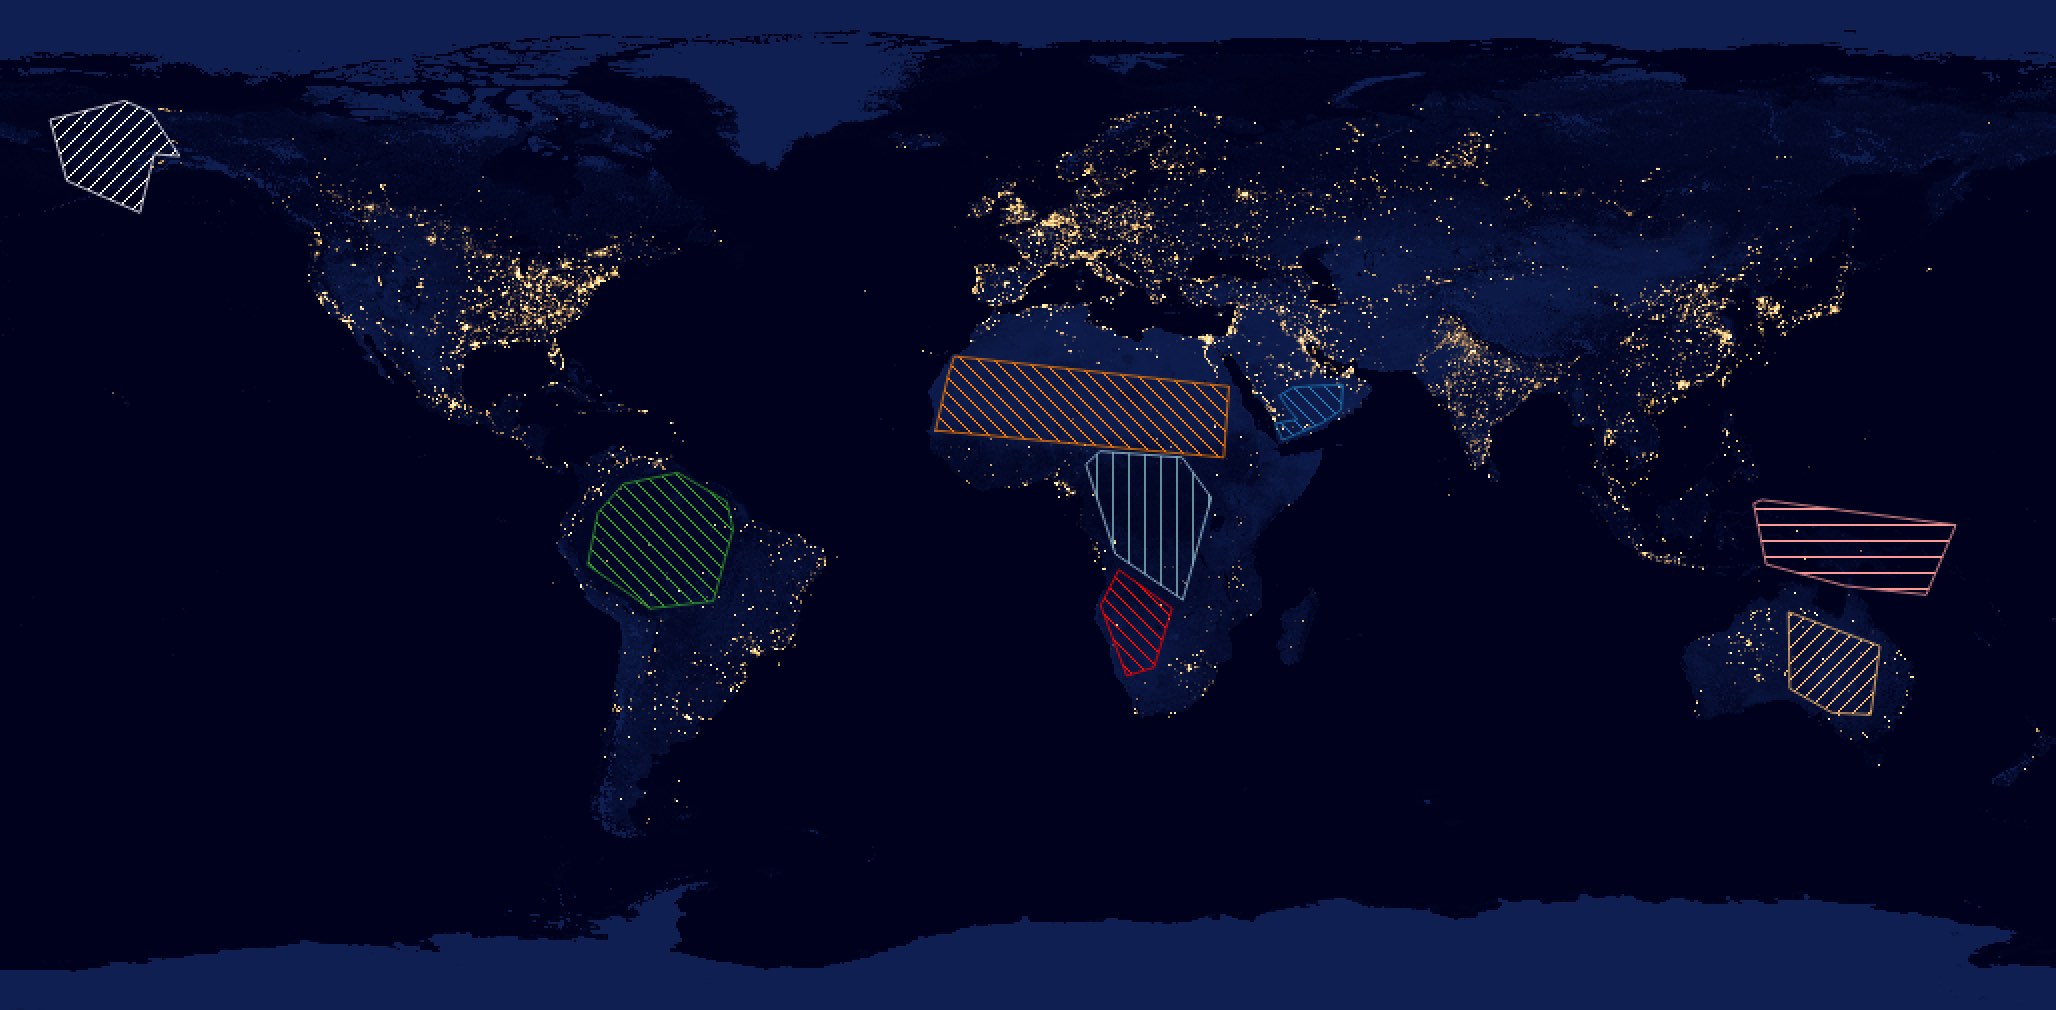
I certainly have and set about building a set of simple tools that would let me explore the human impact on some of the most remote places on earth. To start, I assembled a handful of rough shapefiles that I felt defined would yield some of the most unexpected human activity. From west to east, I bounded Northern Alaska, the heart of Brazil and Peru’s Amazon, the Sahara Desert, the jungles of DRC and environs, the Namib, the southern Arabian Peninsula, the islands surrounding Papua New Gineau, and the Australian Outback. My objective was to determine the source of the VIIRSA signals in these remote areas, which were suggested by NASA to be gas flares, fires, lightning, auroras, reflected moonlight, or really any other sign of civilization. I wanted to devise a method to turn the big, nasty GeoTIFFs available from NASA into searchable lists that would help me understand these mysterious lights emanating from the vast expanses that I thought had escaped the clutches of our civilization.
Given the thousands of bright pixels, I couldn’t possibly investigate each one individually. My method would be to divide the world into zones above, sort the pixels by brightness, and return their locations in a sorted list. To take it a step further, I would also take advantage of Google’s Places API to reverse geocode their coordinates into human-readable names that would assist in the process. Unfortunately, there is precious little information available online explaining how to turn a GeoTIFF into an array on which simple arithmetic can be performed. All of the files to walk along are available on GitHub, but I walk through the code below step-by-step.
First, I had to import the image and convert the difficult-to-handle GeoTIFF into an easy-to-handle NumPy (or even better, Pandas) array. The first lines obviously just ask the user for the raw image and the masks. Note that if you are running this code yourself, you will need to include the extensions in your responses and the .shp helper files should be in the same directory. If you are having trouble getting anything to work, use the New Guinea example up on GitHub.
def import_image():
image_variable = str(random.randint(1, 10000))
image_name = raw_input(“Which scene would you like to analyze? Note that it must be in this root directory.”)
mask_name = raw_input(“Which file would you like to use to mask your scene? Note that it must be in this root directory.”)
Next, we use the GDAL CLI to clip the image to minimize the size of the final array and the time to perform a sort. While this example uses a fairly small 3600 x 1800 (6.5 MP) image, I have run this code on much larger images and cropping become necessary. Because I was too lazy to actually incorporate the GDAL Python APIs, make sure that the GDAL CLI is installed (“brew install gdal” works).
# Clip the image with gdalwarp
# You must hahe gdal installed for this script to work
os.system(“gdalwarp -q -cutline “+your_directory+mask_name+” -crop_to_cutline -dstalpha -tr 0.1 0.1 -of GTiff “+your_directory+image_name+” “+your_directory+image_variable+”.tif”)
The block below transforms the first channel of the image into an array. Discovering this functionality in GDAL and the existence of the .xyz file format took a surprising amount of time, but this seems to be the best way to evolve the image into an array on which we can perform our sorting.
# Turn the tiff into a text file
os.system(“gdal_translate -of XYZ “+your_directory+image_variable+”.tif “+your_directory+image_variable+”.xyz”)
print “gdal_translate -of XYZ “+your_directory+image_variable+”.tif “+your_directory+image_variable+”.xyz”
Finally, we generate an intermediate space-delimited file that is returned and ready for our second step.
data = genfromtxt(image_variable+”.xyz”, delimiter=’ ‘)
return data
Our second step begins by reading the output of the first function and dumping it into a NumPy array that we sort by the third column, pixel brightness.
def sort_by_intensity(data):
data = np.array(data)
data = data[data[:,2].argsort()]
We then write the n most intense rows to a .csv for record keeping or further processing.
# This function writes the n most intense rows to a csv
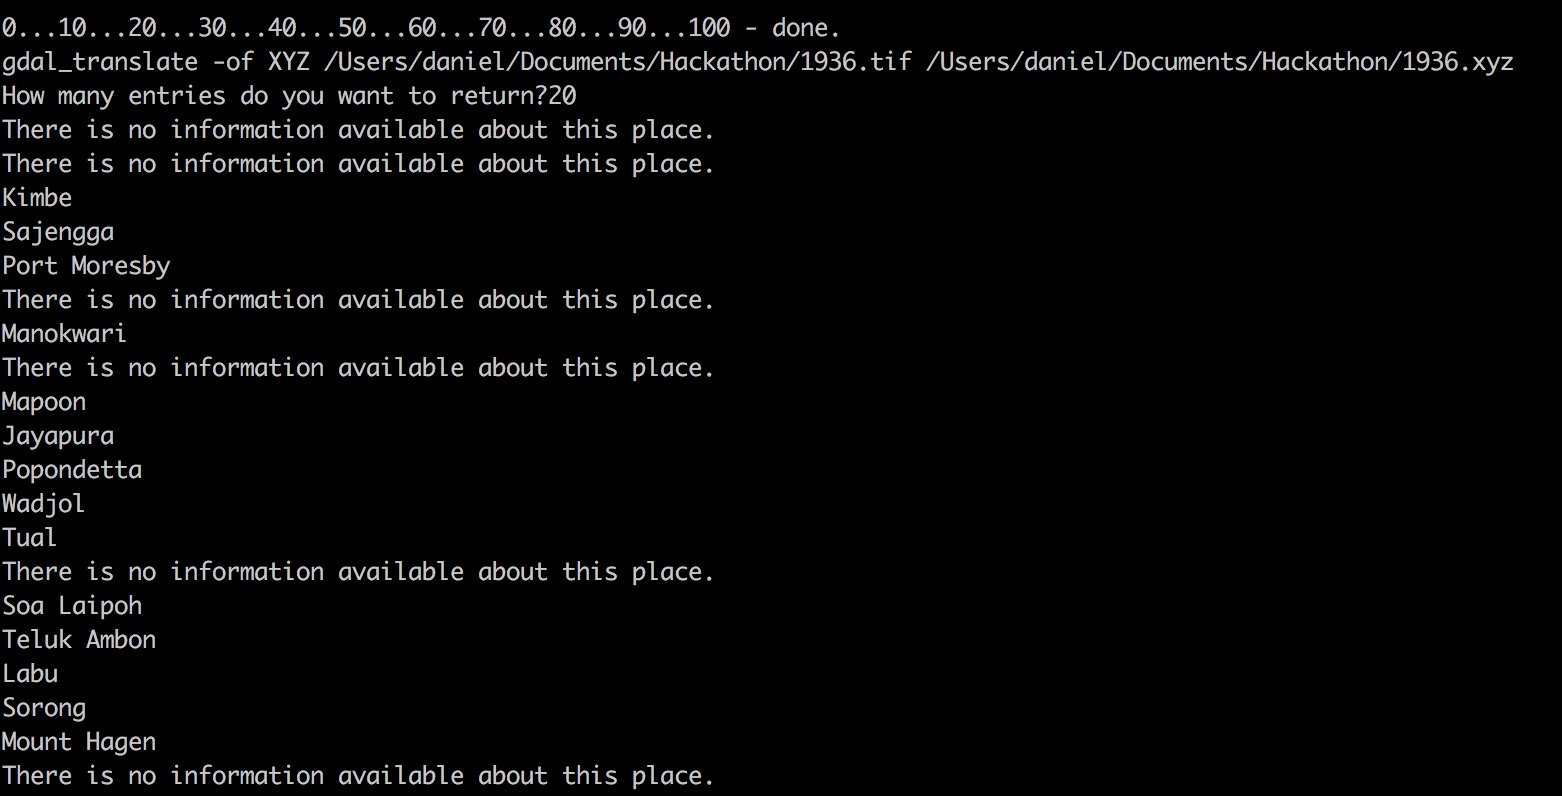
number_of_entries = raw_input(“How many entries do you want to return?”)
data = data[-int(number_of_entries):,:]
numpy.savetxt(“sorted_data.csv”, data, delimiter=”,”)
This trimmed array is then fed into the Google Places API, which reverse geocodes the latitude and longitude into place names found within 5 km. To sign up for your own key, head over to https://console.cloud.google.com/. The ascii encoding and decoding line is to prevent NumPy from throwing an error when trying to write non-ASCII characters to the final table. The Google Places API will return Arabic, Cyrilic, and other alphabets, which are not supported by NumPy.
# This function loops over the array, calls the Google Places API, and appends the name as another column.
n=-1
place=[]
while n >= -int(number_of_entries):
location = requests.get(“https://maps.googleapis.com/maps/api/place/nearbysearch/json?location=”+str(data[n,1])+”,”+str(data[n,0])+”&radius=5000&key=YOUR_API_KEY”)
response = json.loads(location.text)
if response[“status”] != “ZERO_RESULTS”:
print(response[“results”][0][“vicinity”])
place.append(response[“results”][0][“vicinity”].encode(‘ascii’, ‘ignore’).decode(‘ascii’))
else:
print(“There is no information available about this place.”)
place.append(“There is no information available about this place.”)
n = n-1
Finally, a Mapbox-compatable .csv file is written to enable the easy visualization of your results, which is shown below or available in a full window. Note that the pixel size of the original image is approximately 10 km x 10 km, so the icons may be some distance from the object that actually triggered the signal.
a = place[::-1]
mapbox_array = [a,data[:,1],data[:,0],data[:,2]]
mapbox_array = zip(*mapbox_array)
header = [“title”,”lat”,”lon”,”intensity”]
mapbox_array_header = numpy.vstack([header, mapbox_array])
print mapbox_array_header
numpy.savetxt(“mapbox.csv”, mapbox_array_header, delimiter=”,”, fmt=”%s”)
So what did I learn from my geosleuthing?
First, the Google Places API is very comprehensive. Even the most remote villages in Papua New Guinea registered. The most interesting discoveries were those outside the Google database. When my script returned a “there is no information available about this place”, I knew I could expect a fire, a reflection from the moon, or something very curious.
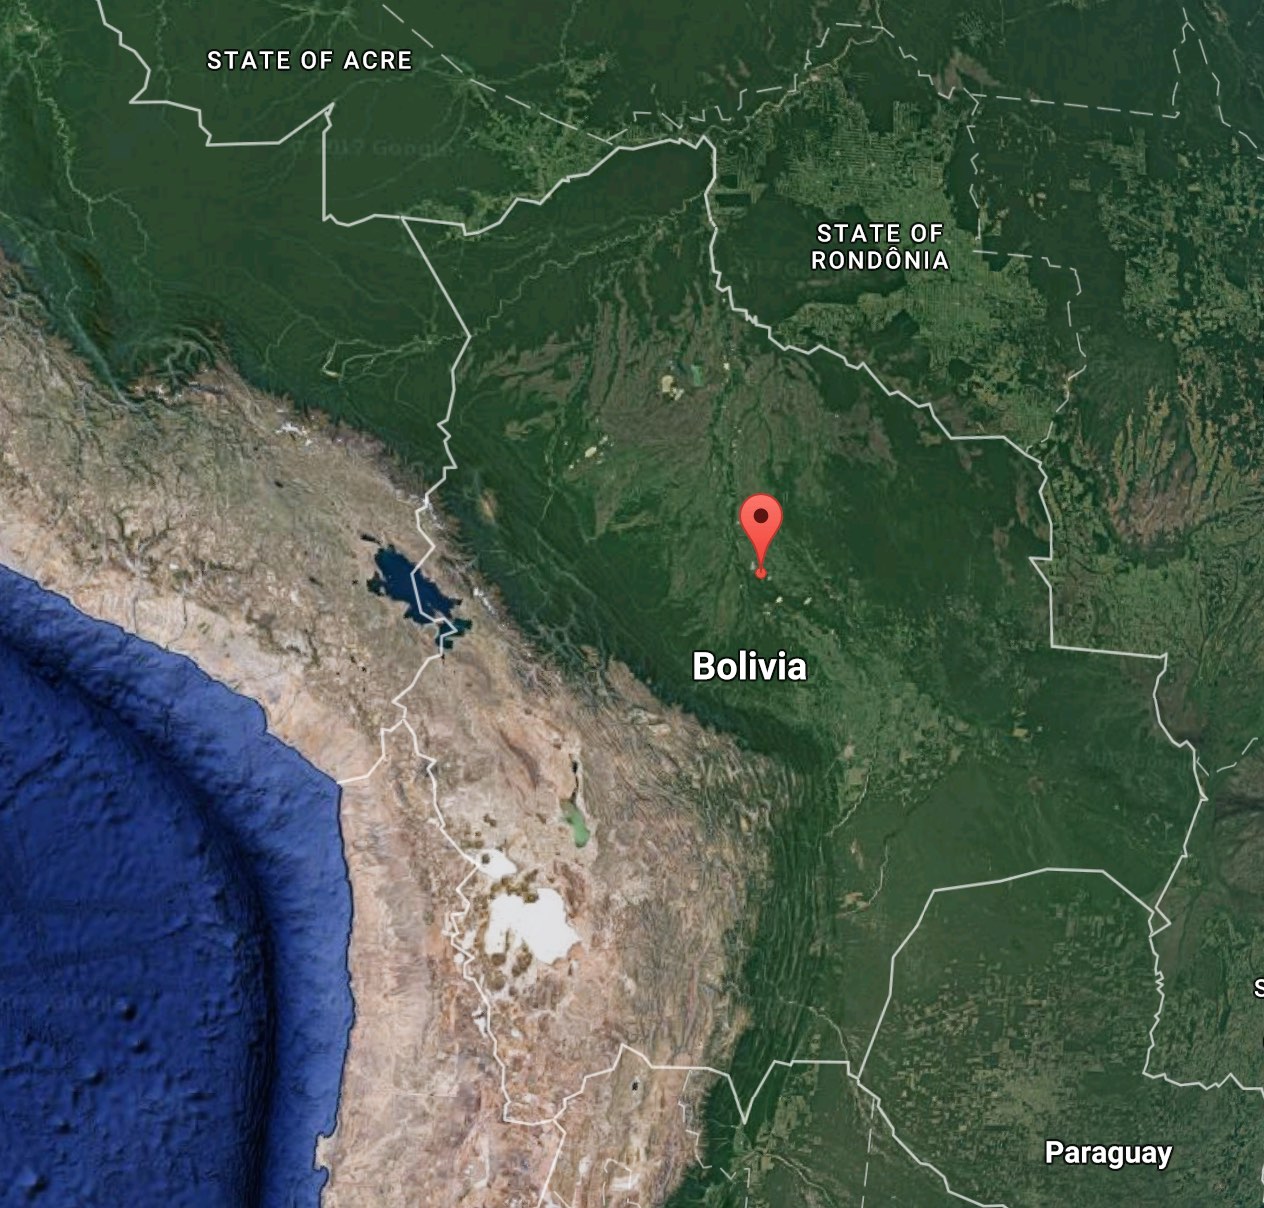
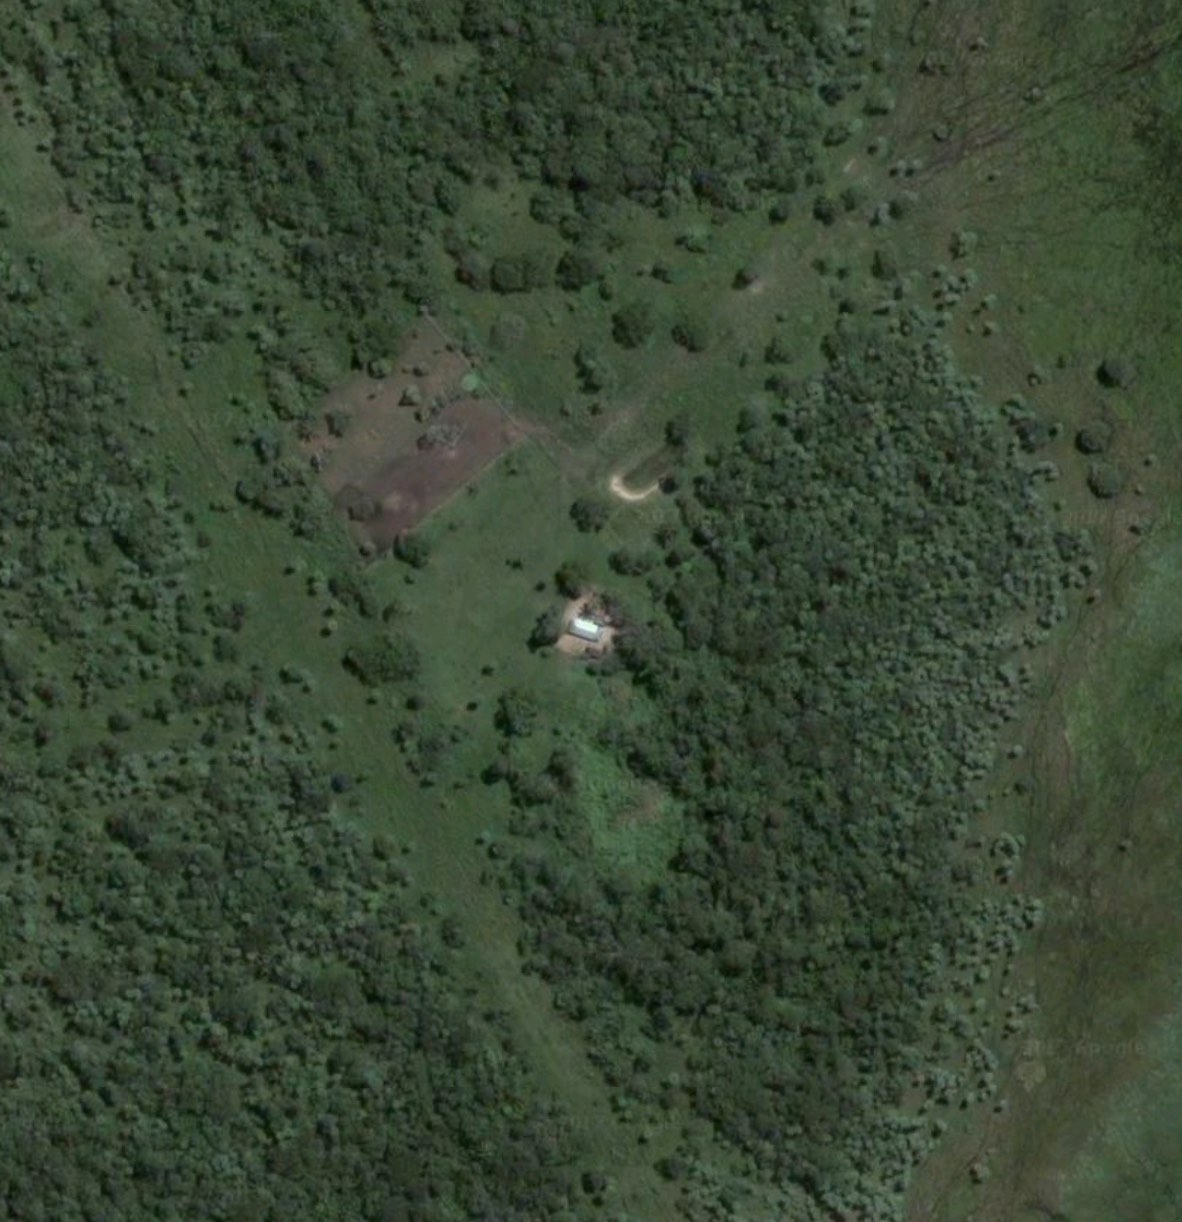
 Second, humans exist in even some of the most remote places on earth. This settlement in Bolivia could be the loneliest on earth to emit a signature visible from space. Fire over to -15.4893663353, -64.5491380286 in Google Maps to have a look for yourself. The only things near that pin are a single building next to perhaps an airstrip cut into the bush and an animal holding pen a few miles south. I would love to know what these people are doing in the middle of Bolivia all alone.
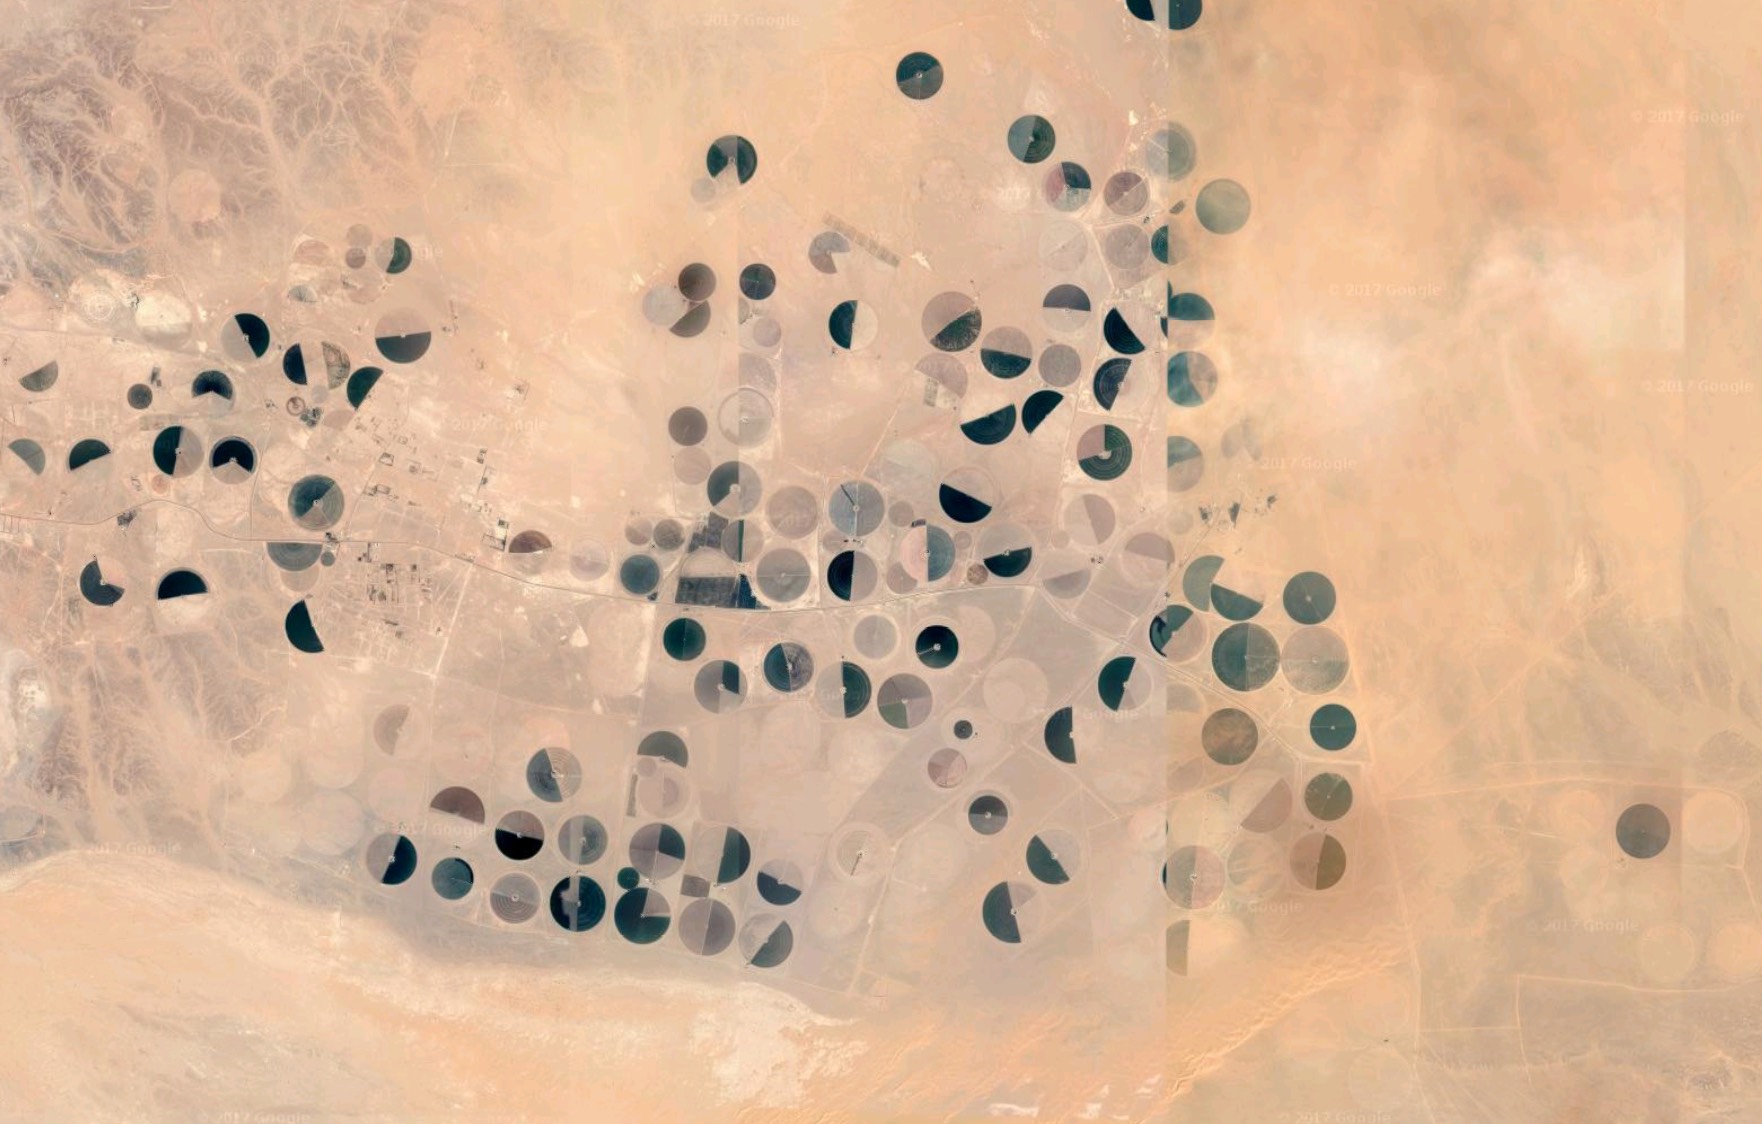
Third, they grow irrigated crops in the middle of the Arabian Peninsula. Most of the VIIRS-detected activity in Saudi Arabia centered around productive farms in the absolute middle of nowhere. Apparently, there are aquifers beneath the desert covering one of the driest places on earth and somehow it makes economic sense to grow what looks to be palm and some kind of row crop. This one is at 20.433801, 45.788945.
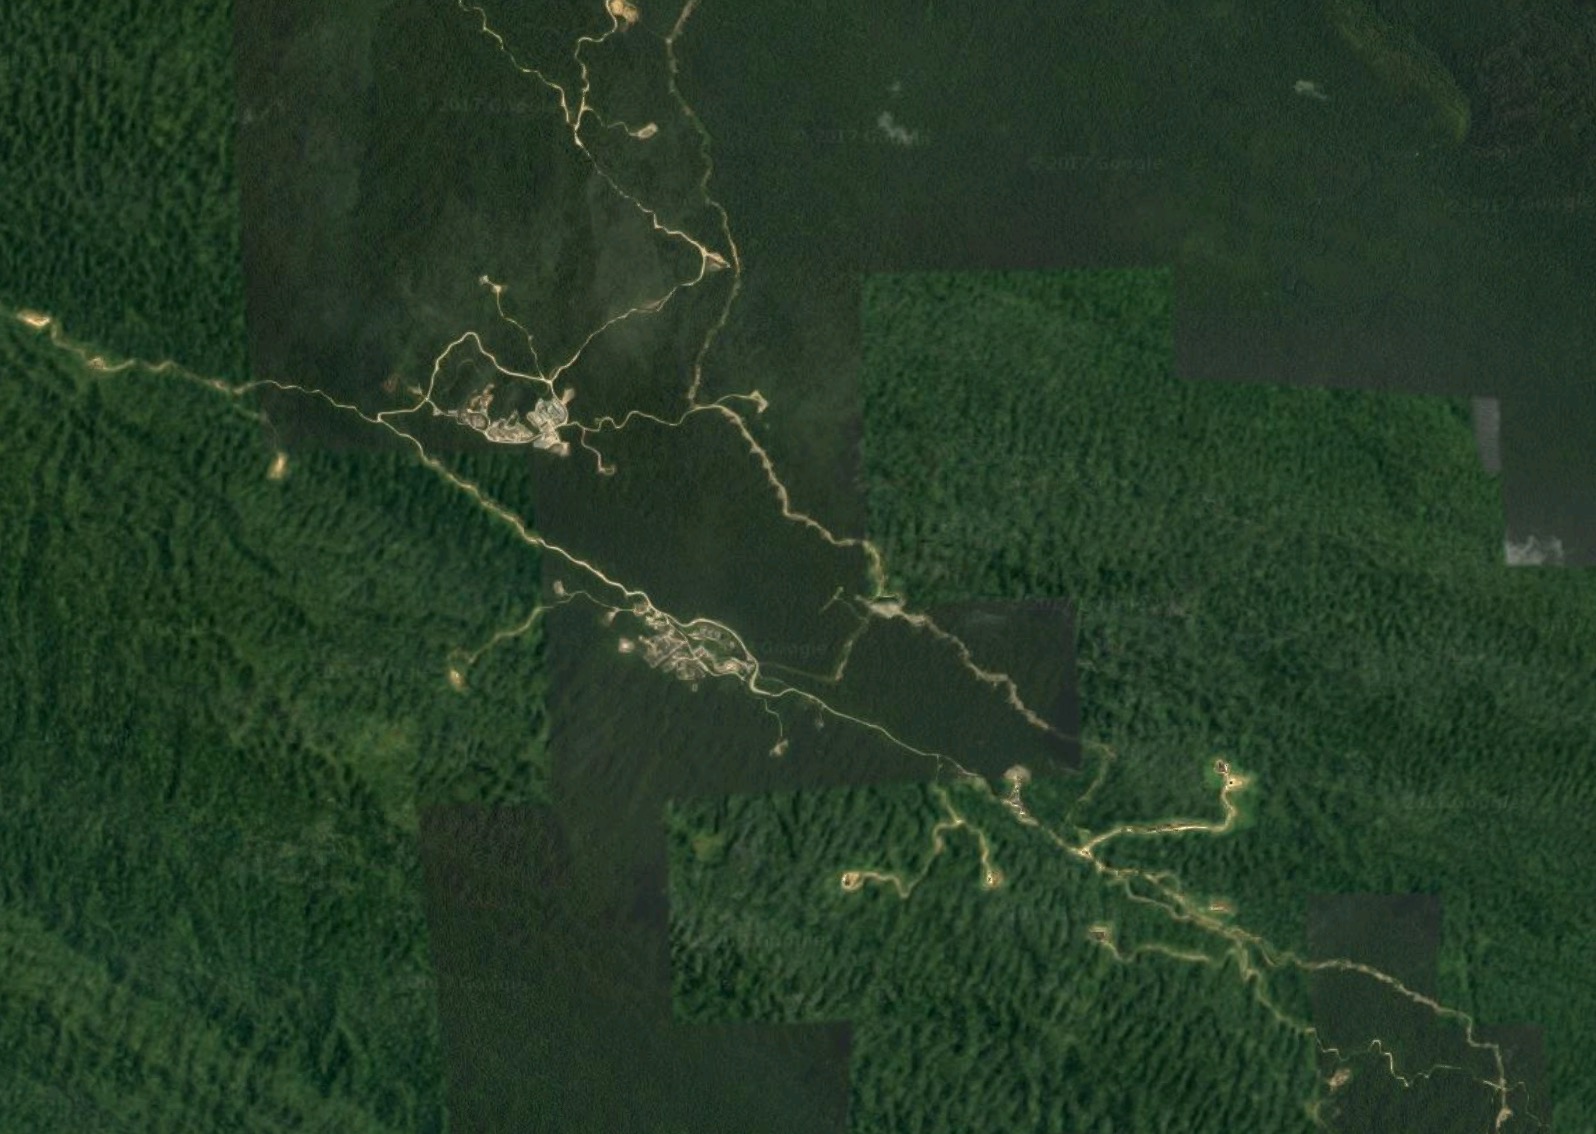
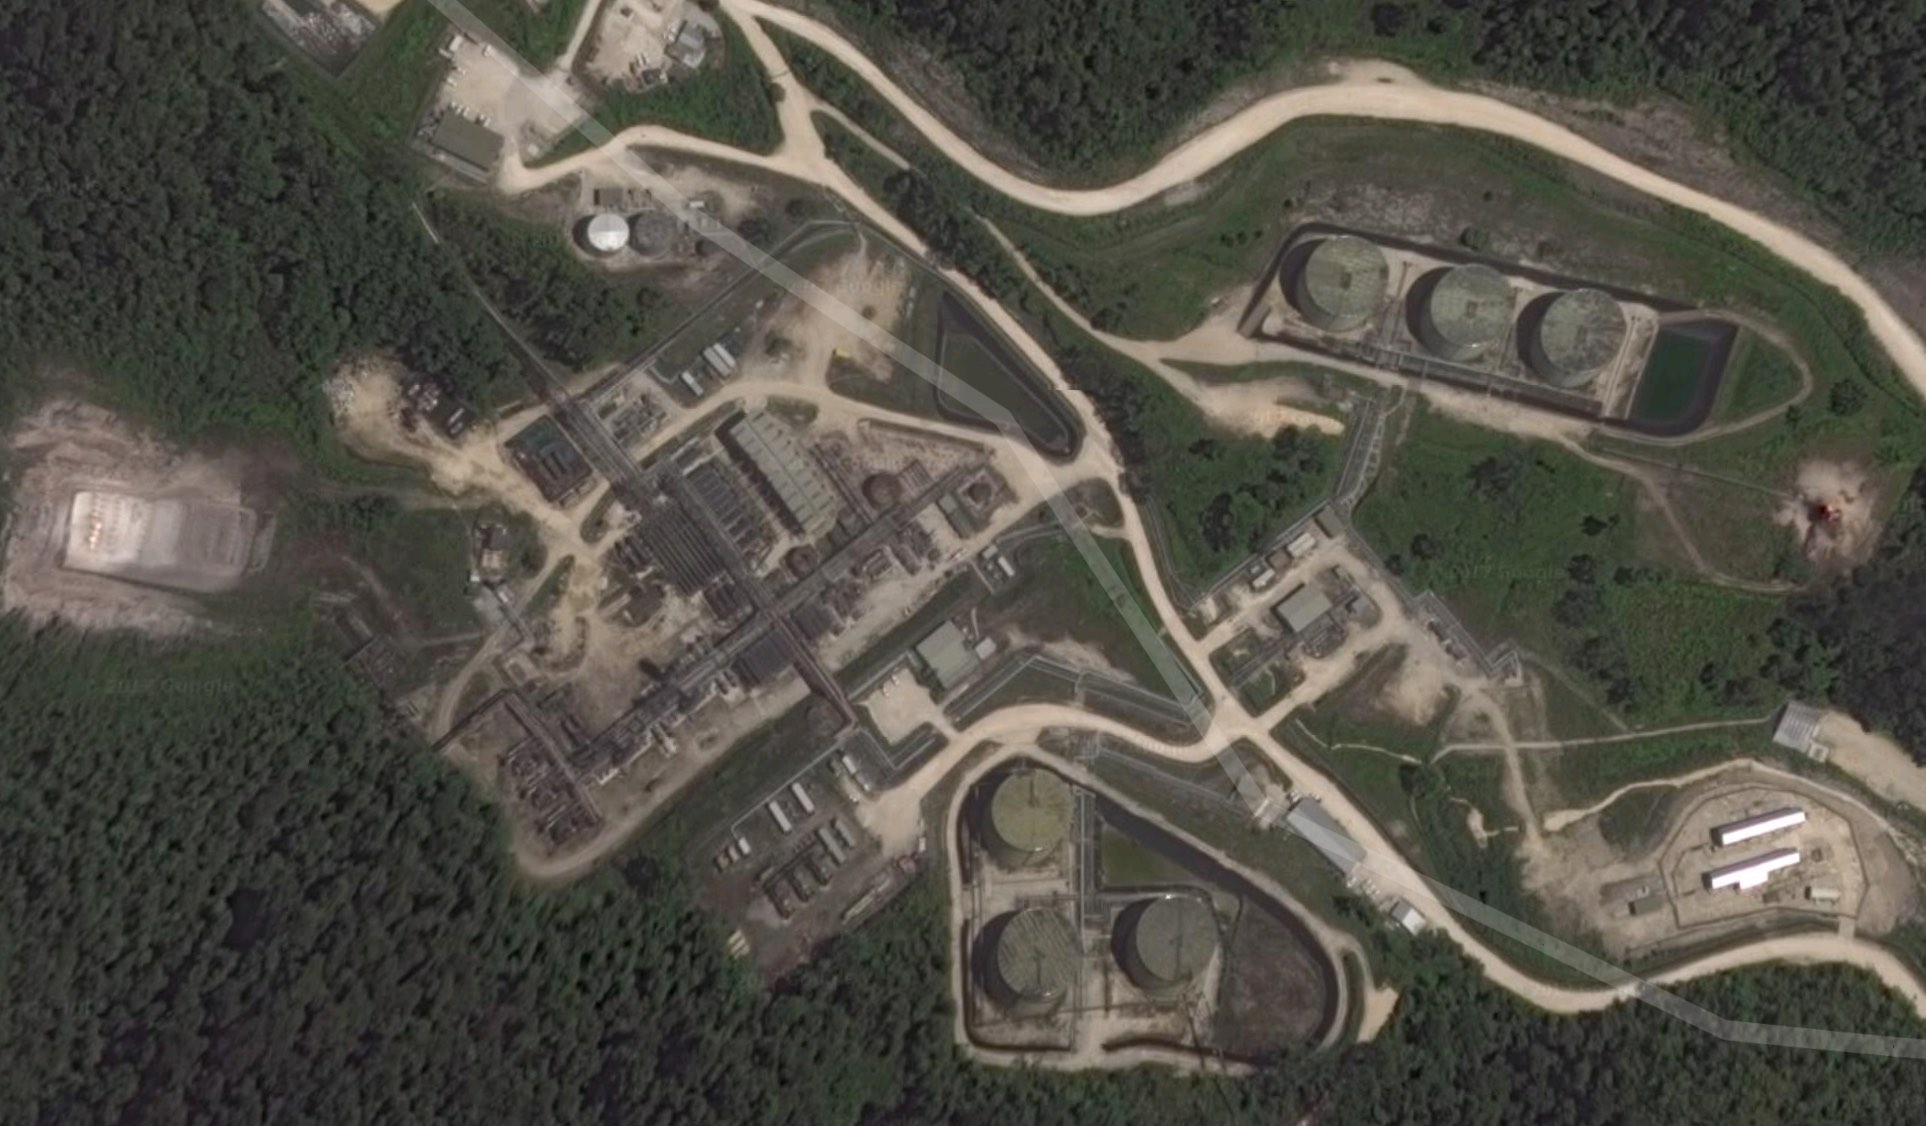
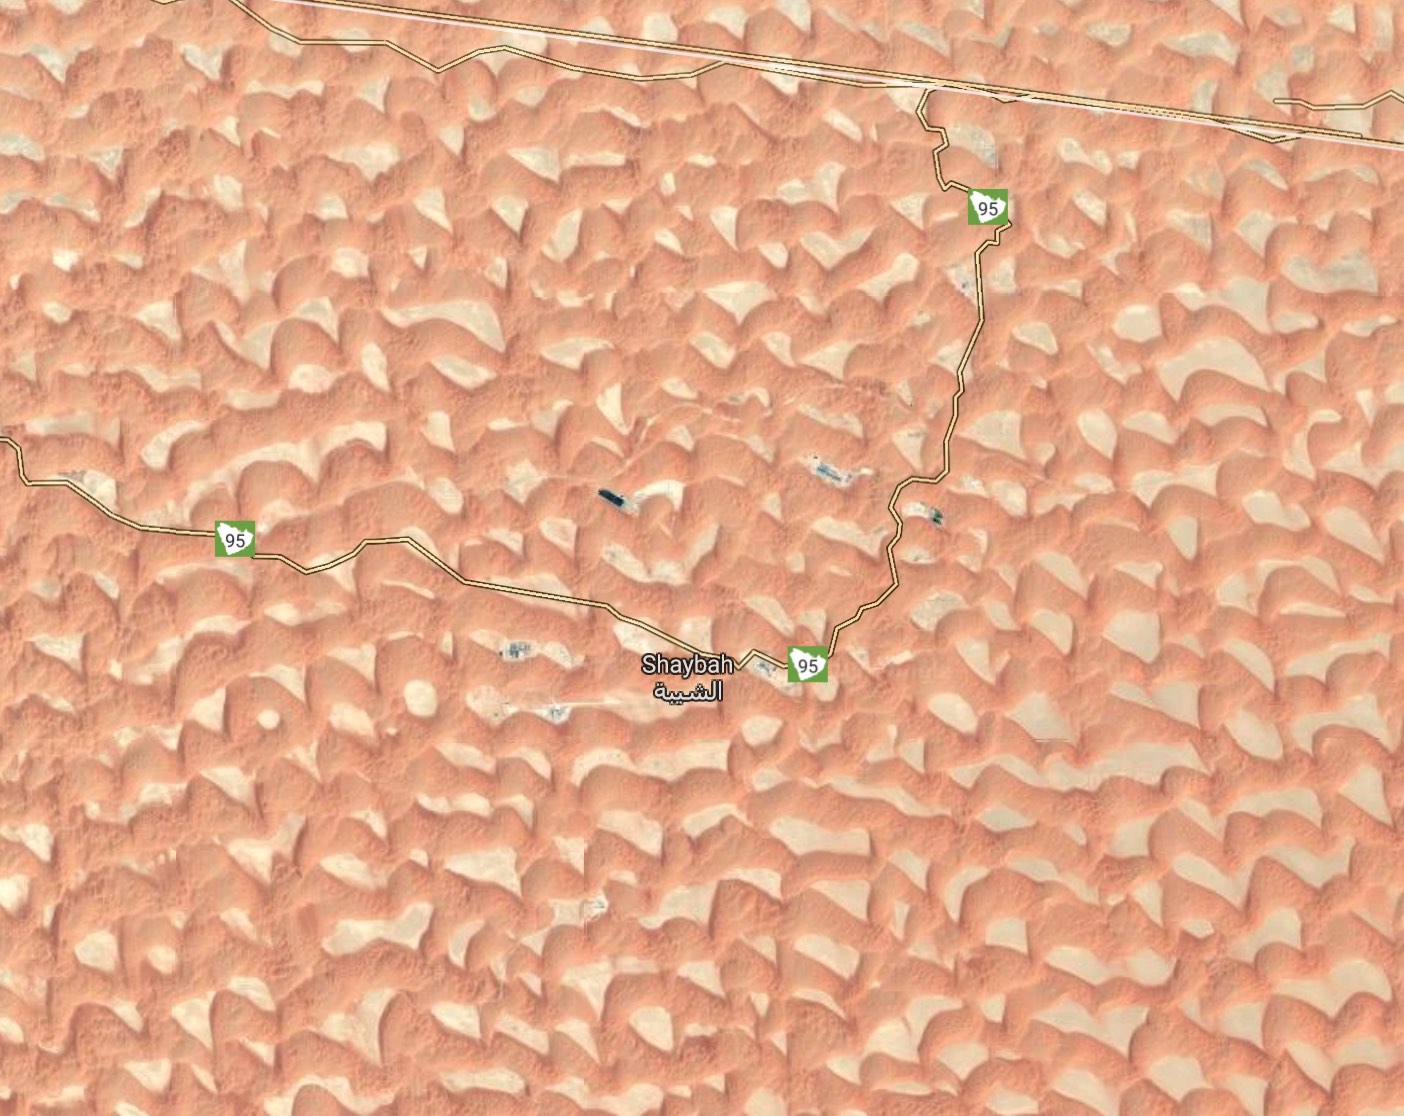
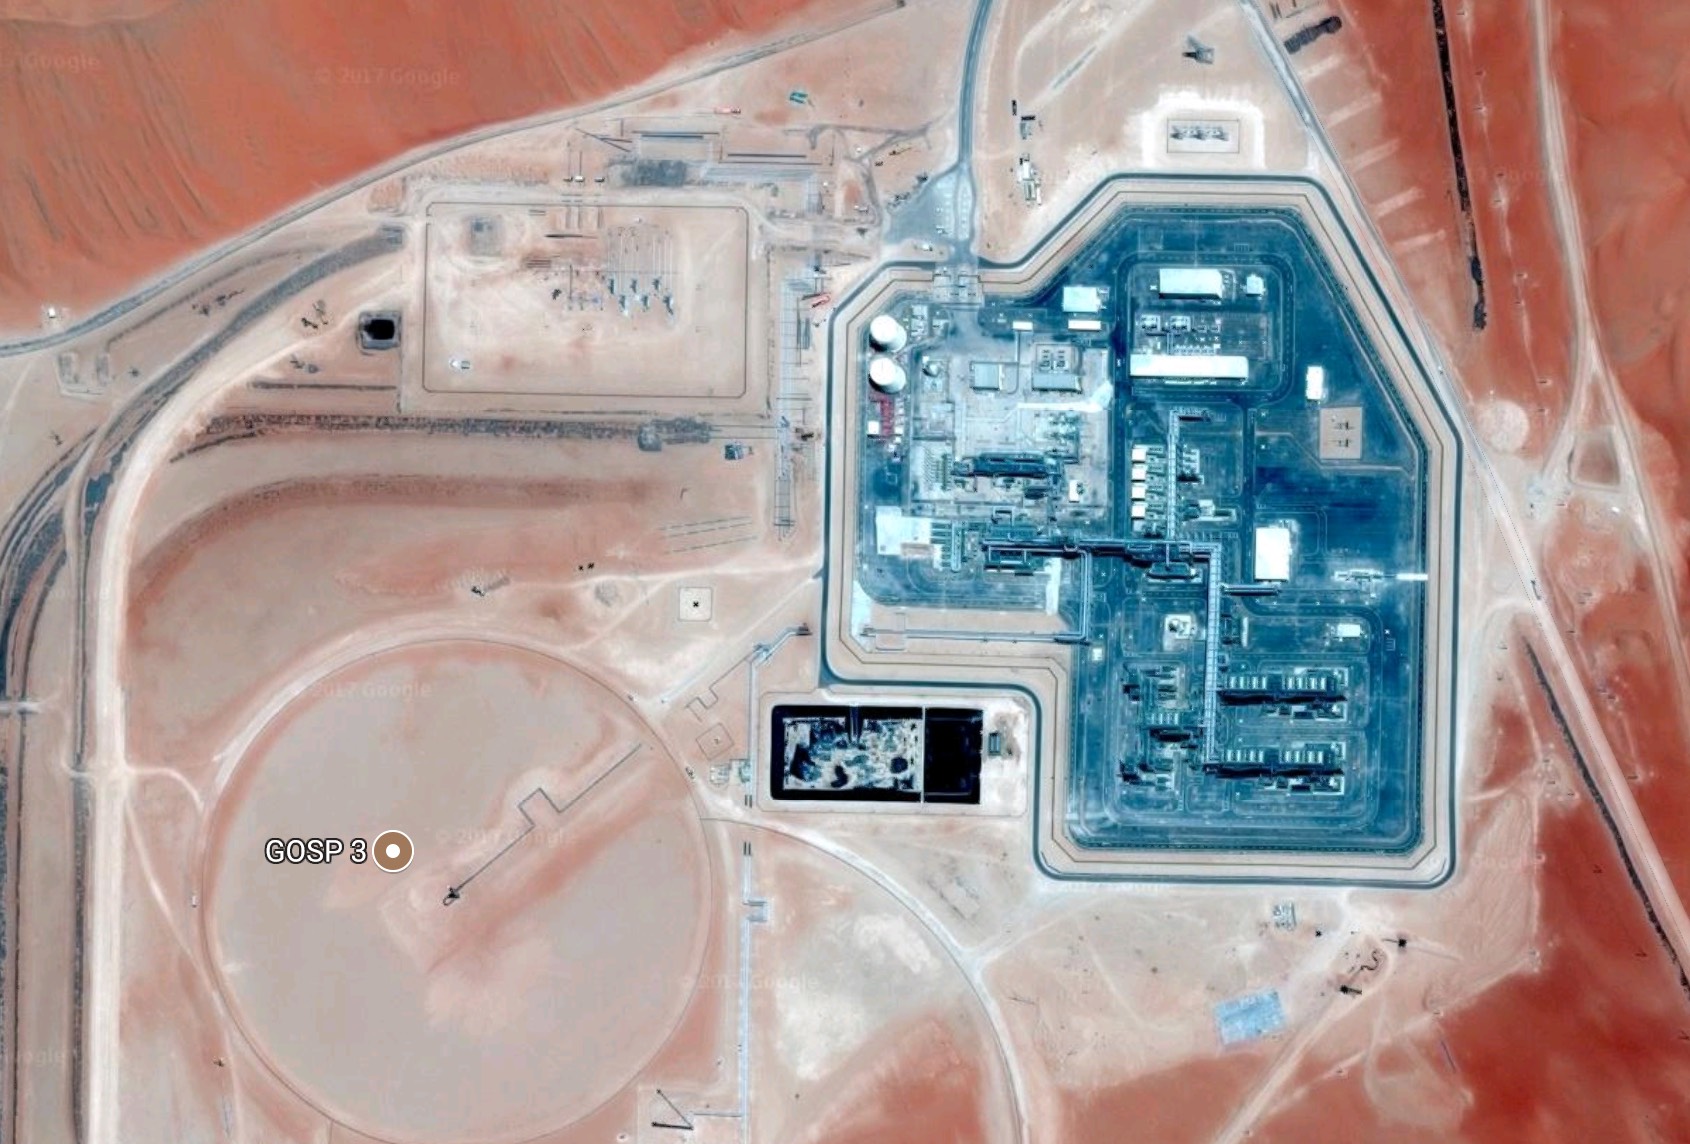
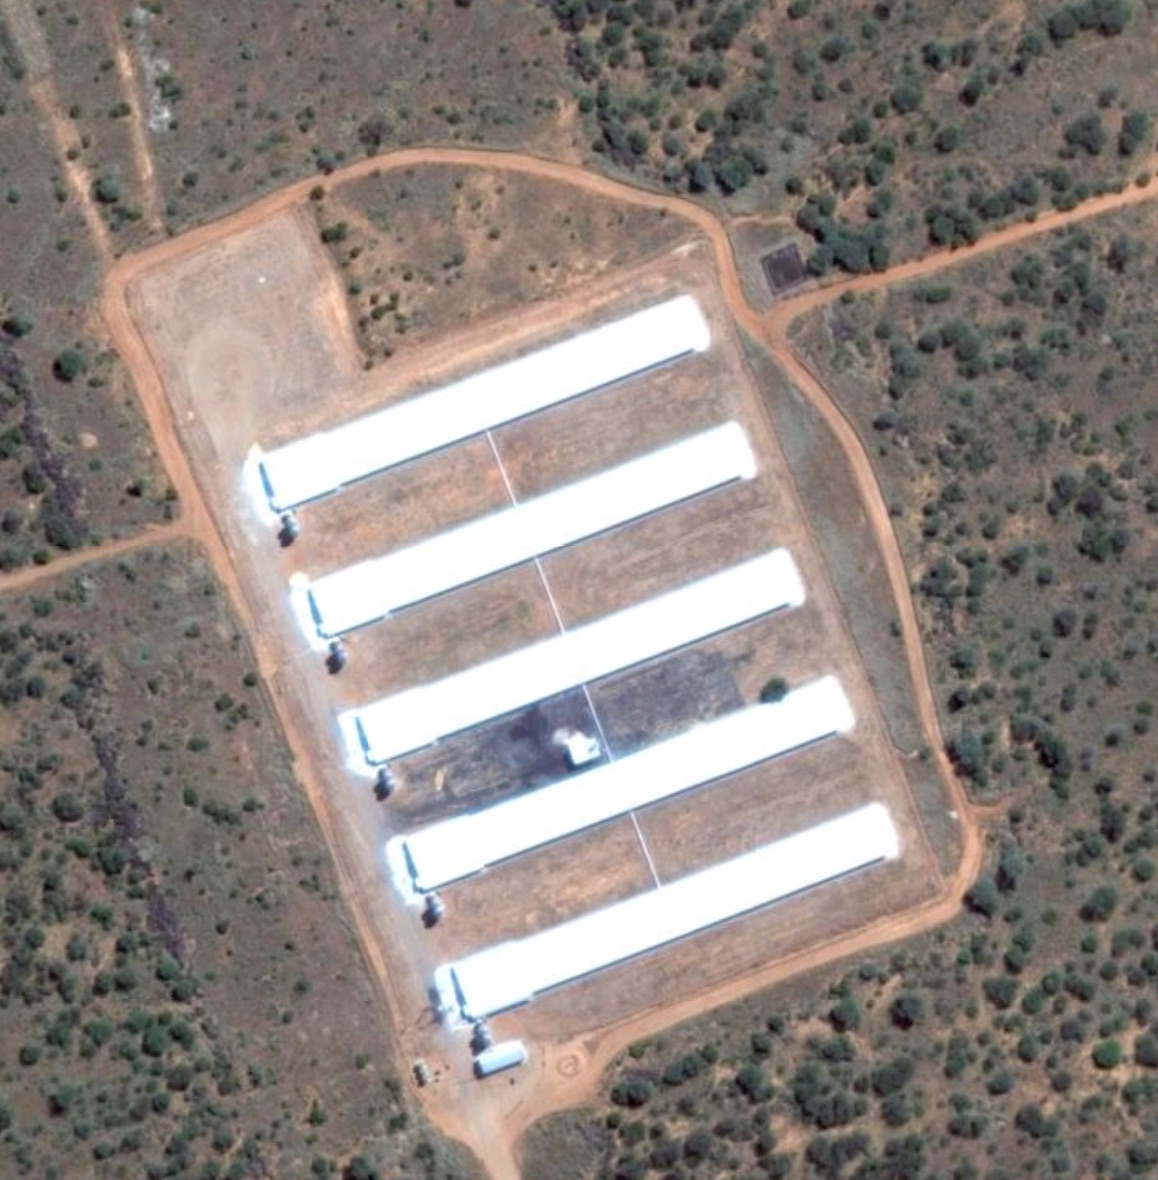
Fourth, the oil and gas industry has explored and developed all corners of the globe. The majority of the reverse geocoded locations that the Google Places API could not assign to a location were some kind of extraction or refining facilities. From the rat’s nest of extraction pads and midstream refining and storage facilities deep in the heart of Papua New Guinea (-6.48971027505, 143.222613444) to sprawling facilities tucked between the red dunes between Saudi Arabia and U.A.E. (22.4299901811, 53.9796060174), facilities ensuring our global supply of energy have infiltrated the most remote locales on earth. I’ll let you guess which pictures below are from P.N.G. and which are from U.A.E. If you look hard between the dunes at the Shaybah oil field, you can find the appalling-looking employee housing (1000 on staff!) and a half-dozen different large pieces of infrastructure.
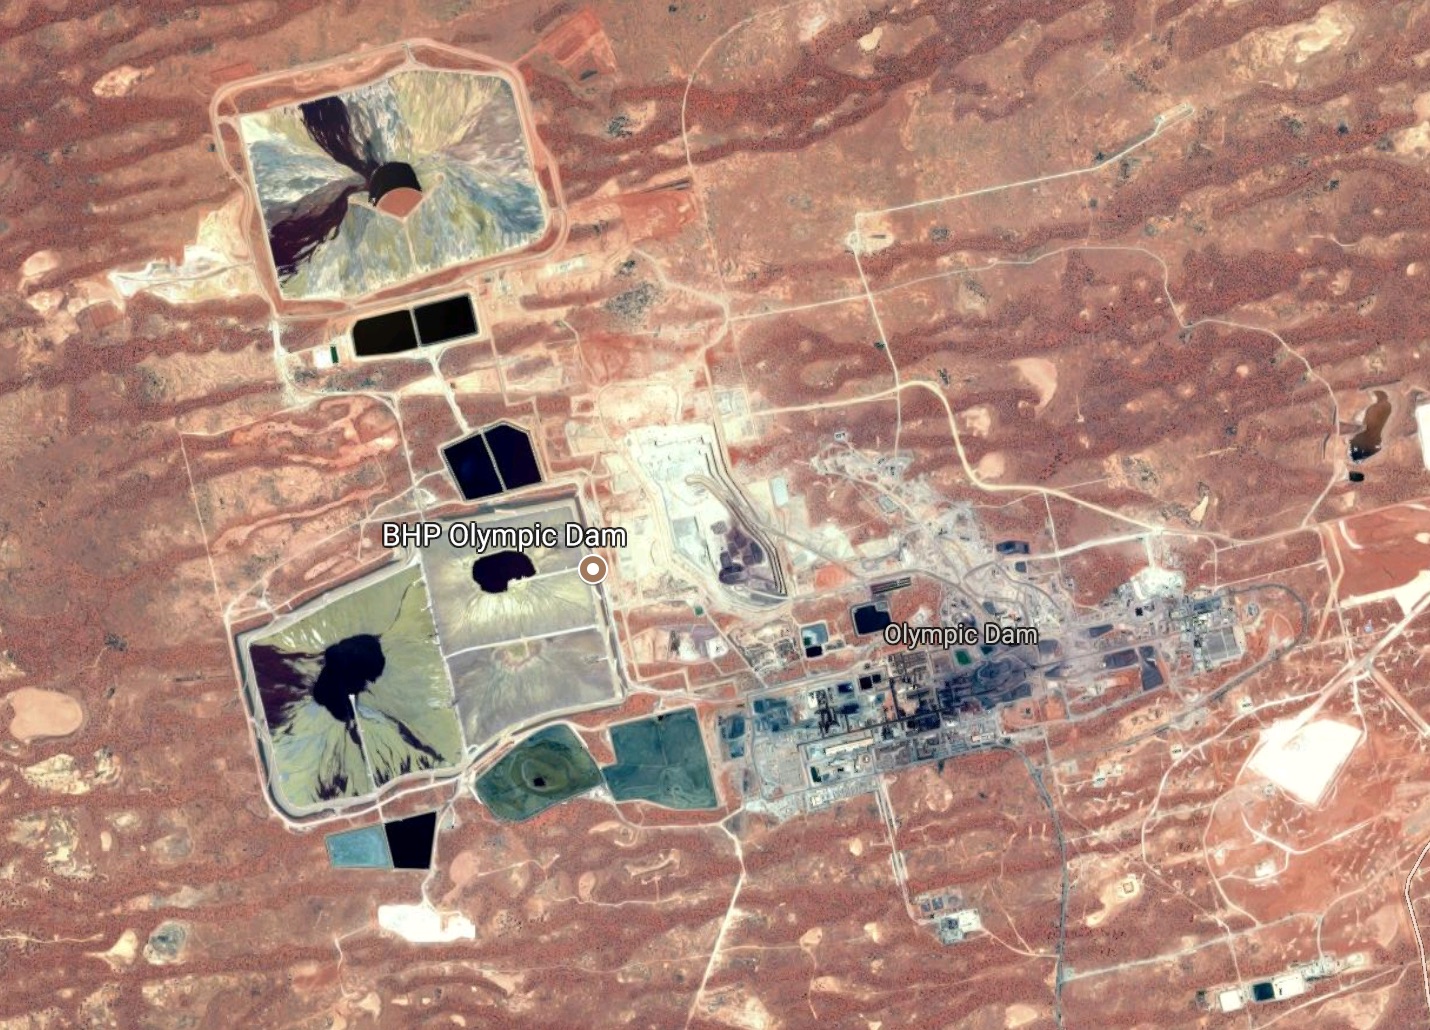
Fifth, mining trails close behind oil and gas in its wandering. I found the Olympic Dam mine in Australia (-30.436219, 136.855881), an underground mine that is sitting on top of the world’s largest known uranium reserves, a, perhaps copper judging by the color, mine in the middle of the jungle in southern D.R.C (-11.1678448514, 27.4567265231), some kind of amateur-looking quarry in Angola (-13.1067125589, 15.6118009747), and potentially some of the wildcat gold mines I’ve read about in the news recently in Nigeria (6.63215514861, 11.3567265231).
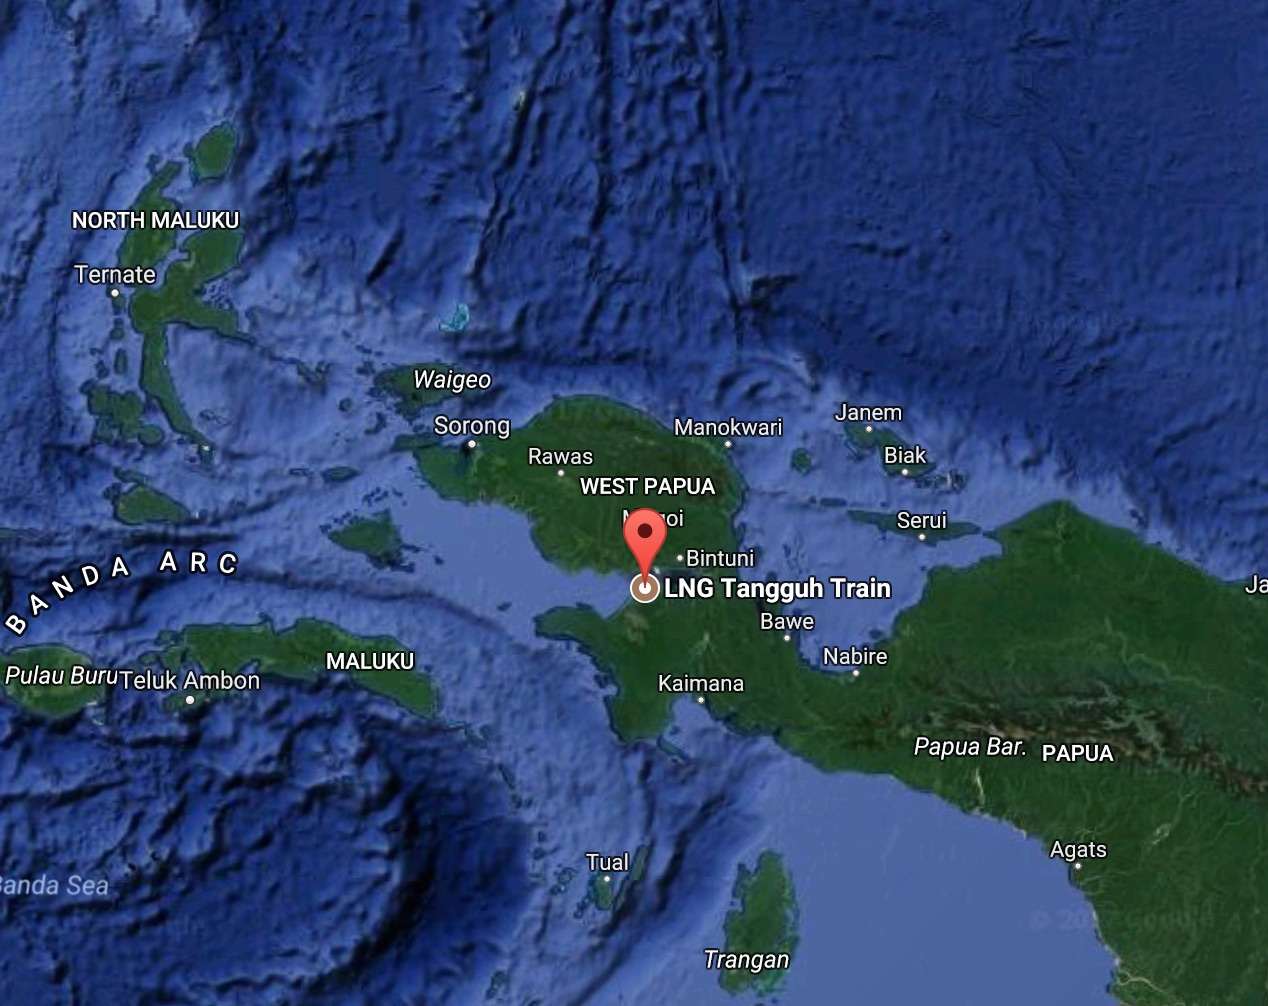
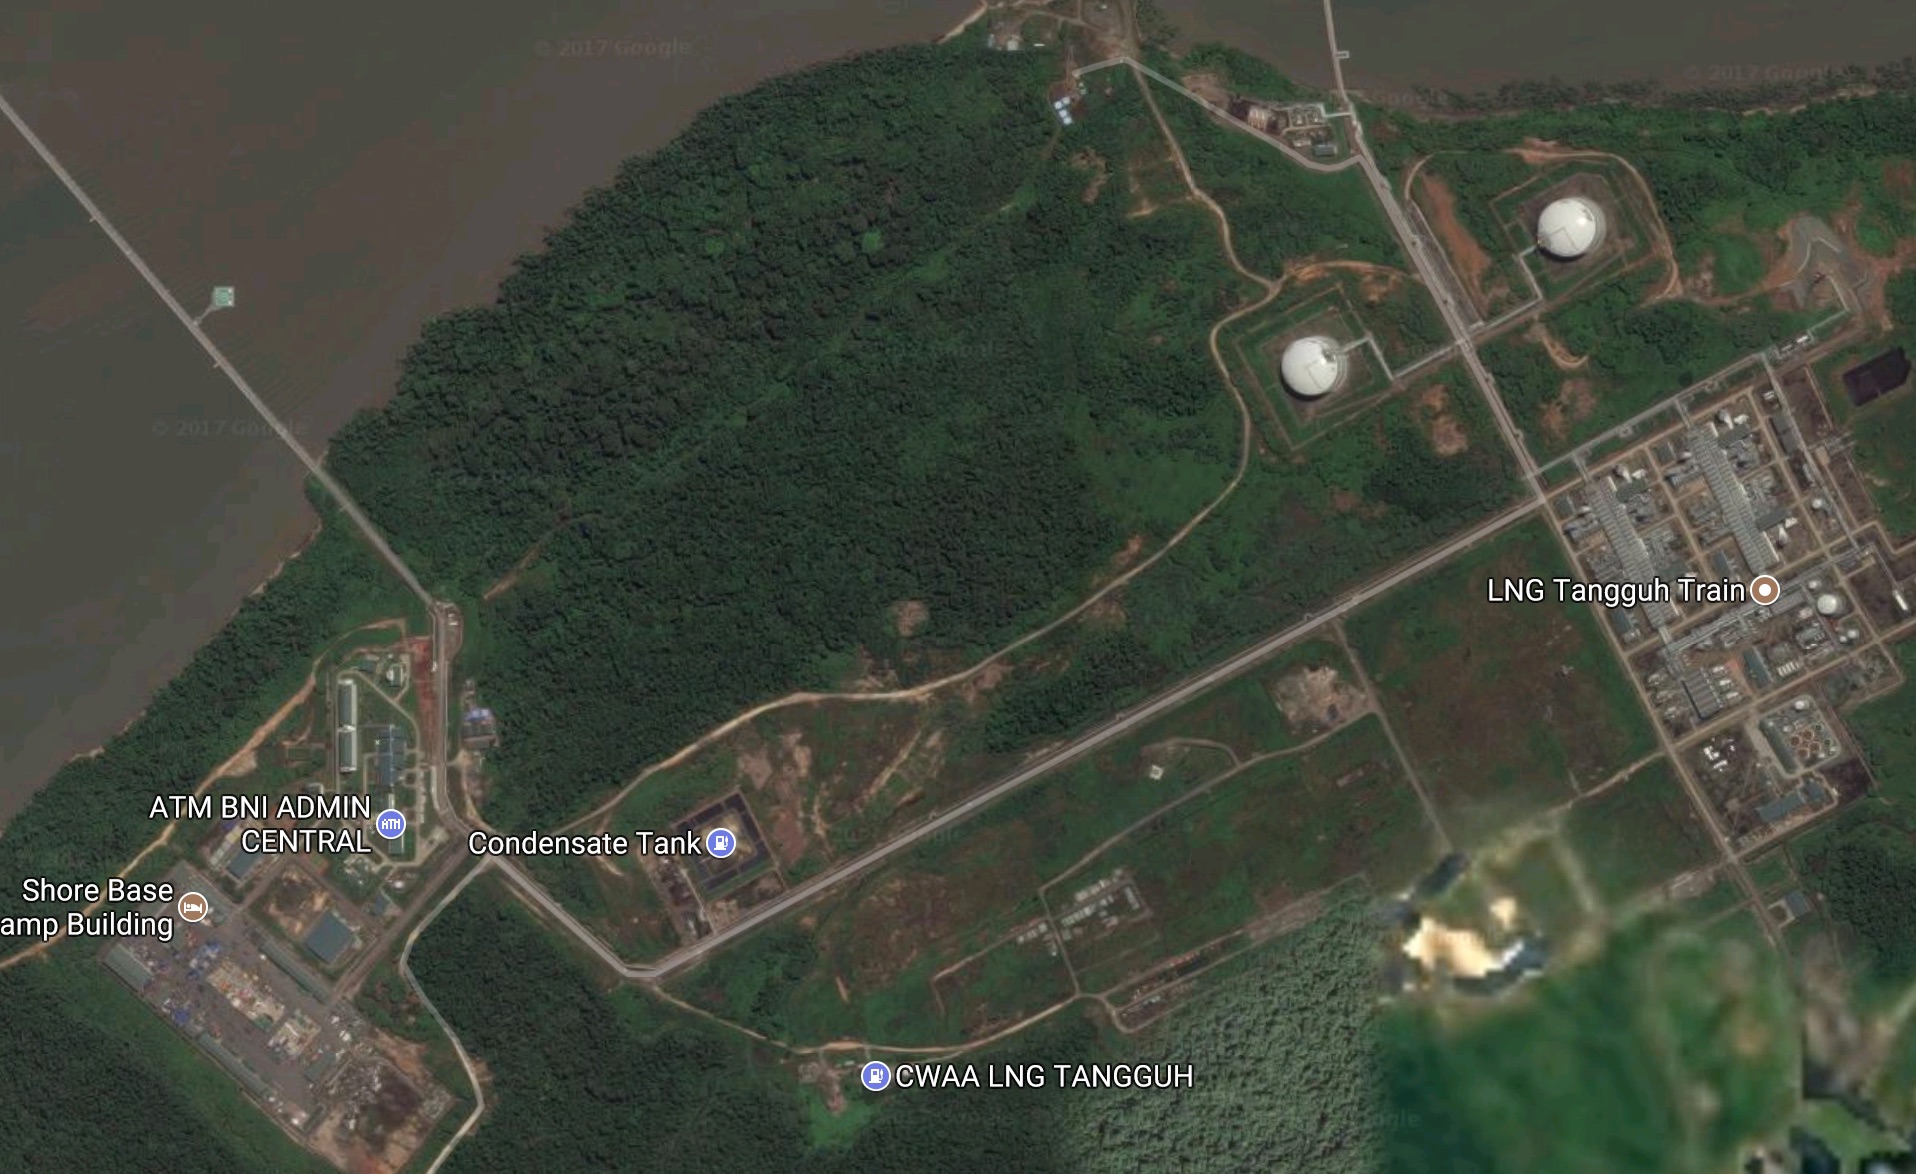
Sixth, there still just some unsolved mysteries in the world. Why is there a large LNG terminal at the top of one of the most remote places on earth (-2.48971027505, 133.122613444)?
Why are there dozens of identical, rectangular structures just north of Windhoek, the capital of Namibia (-22.3067125589, 17.0118009747)?
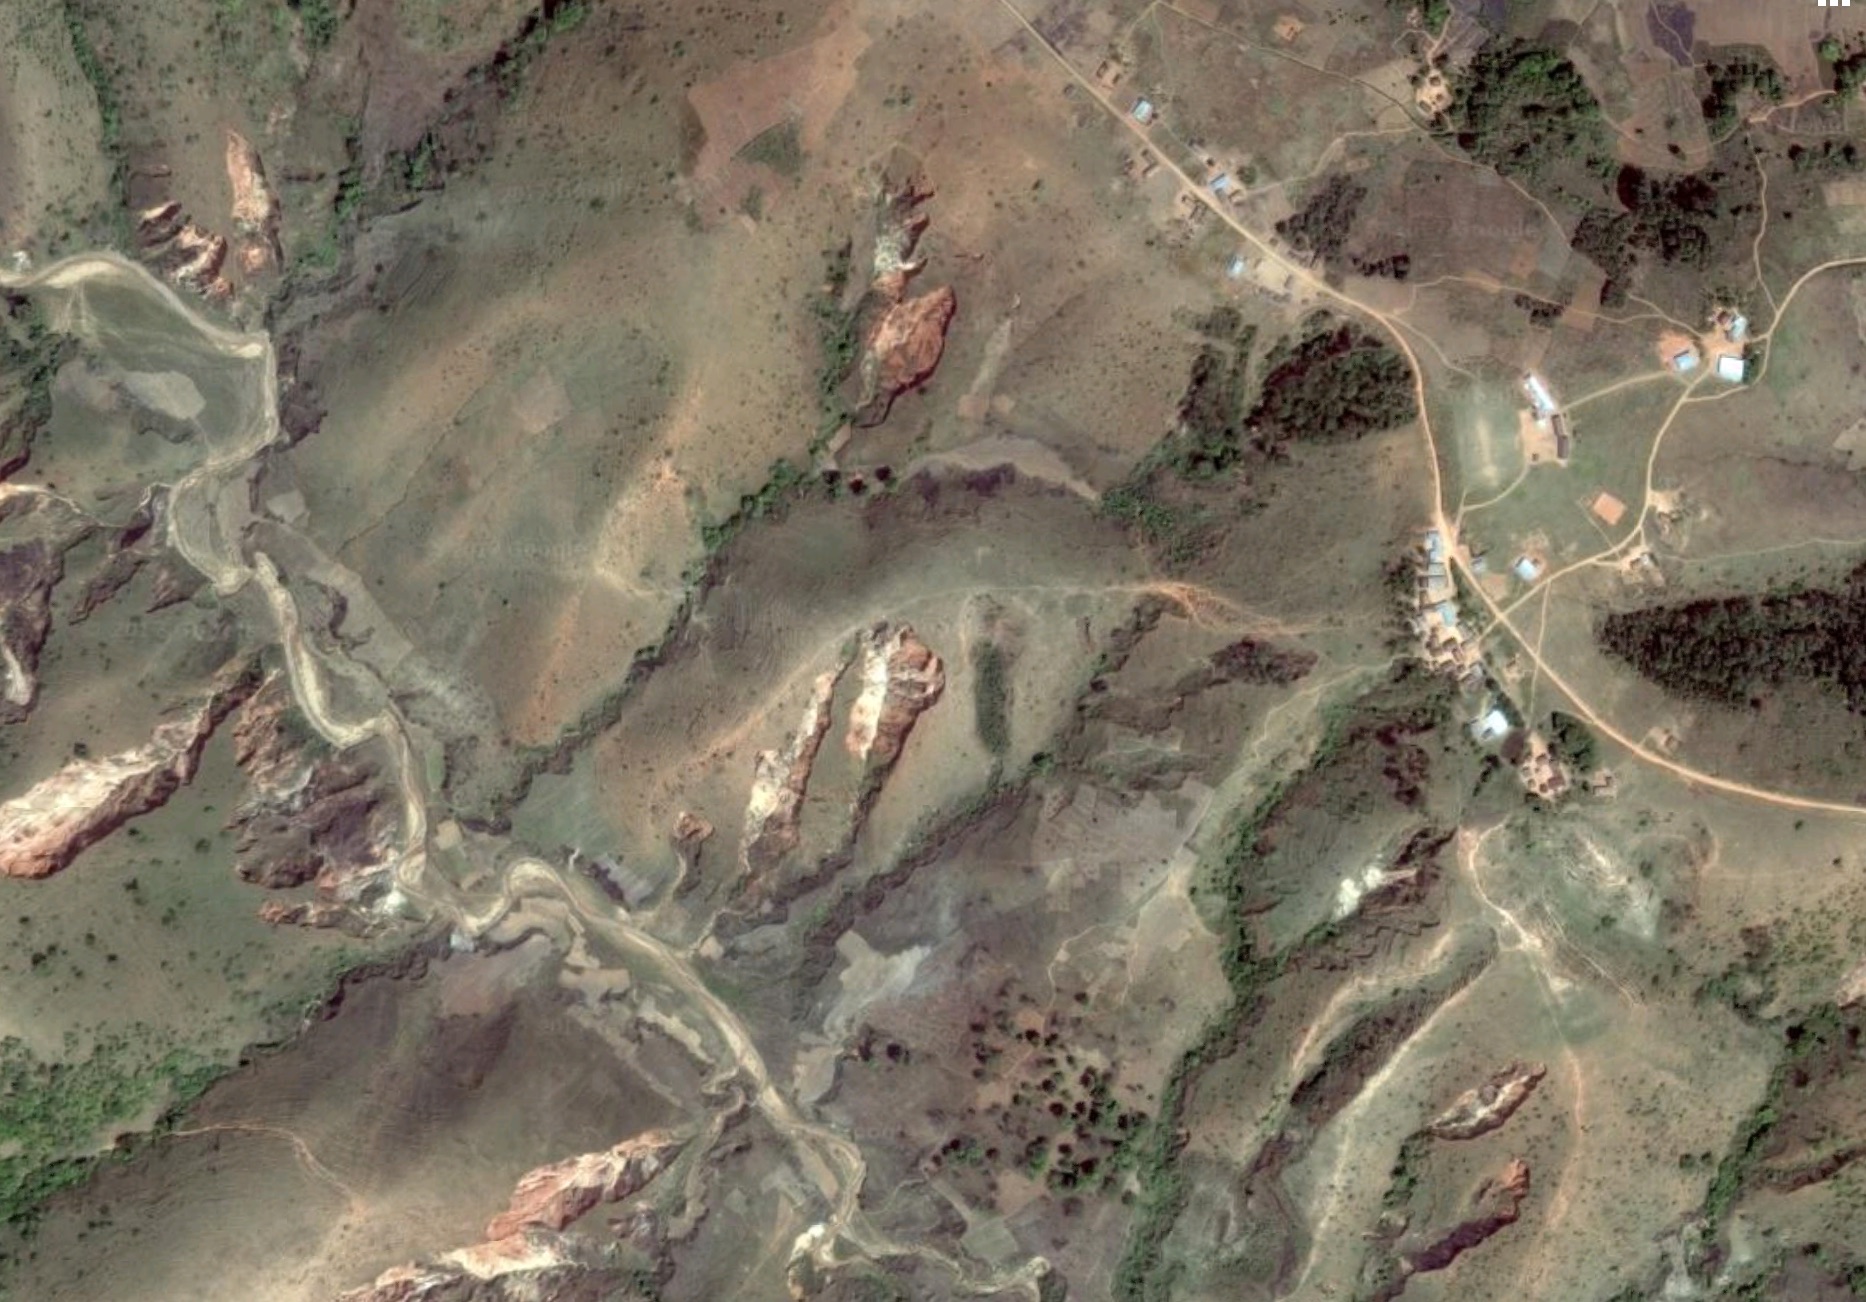
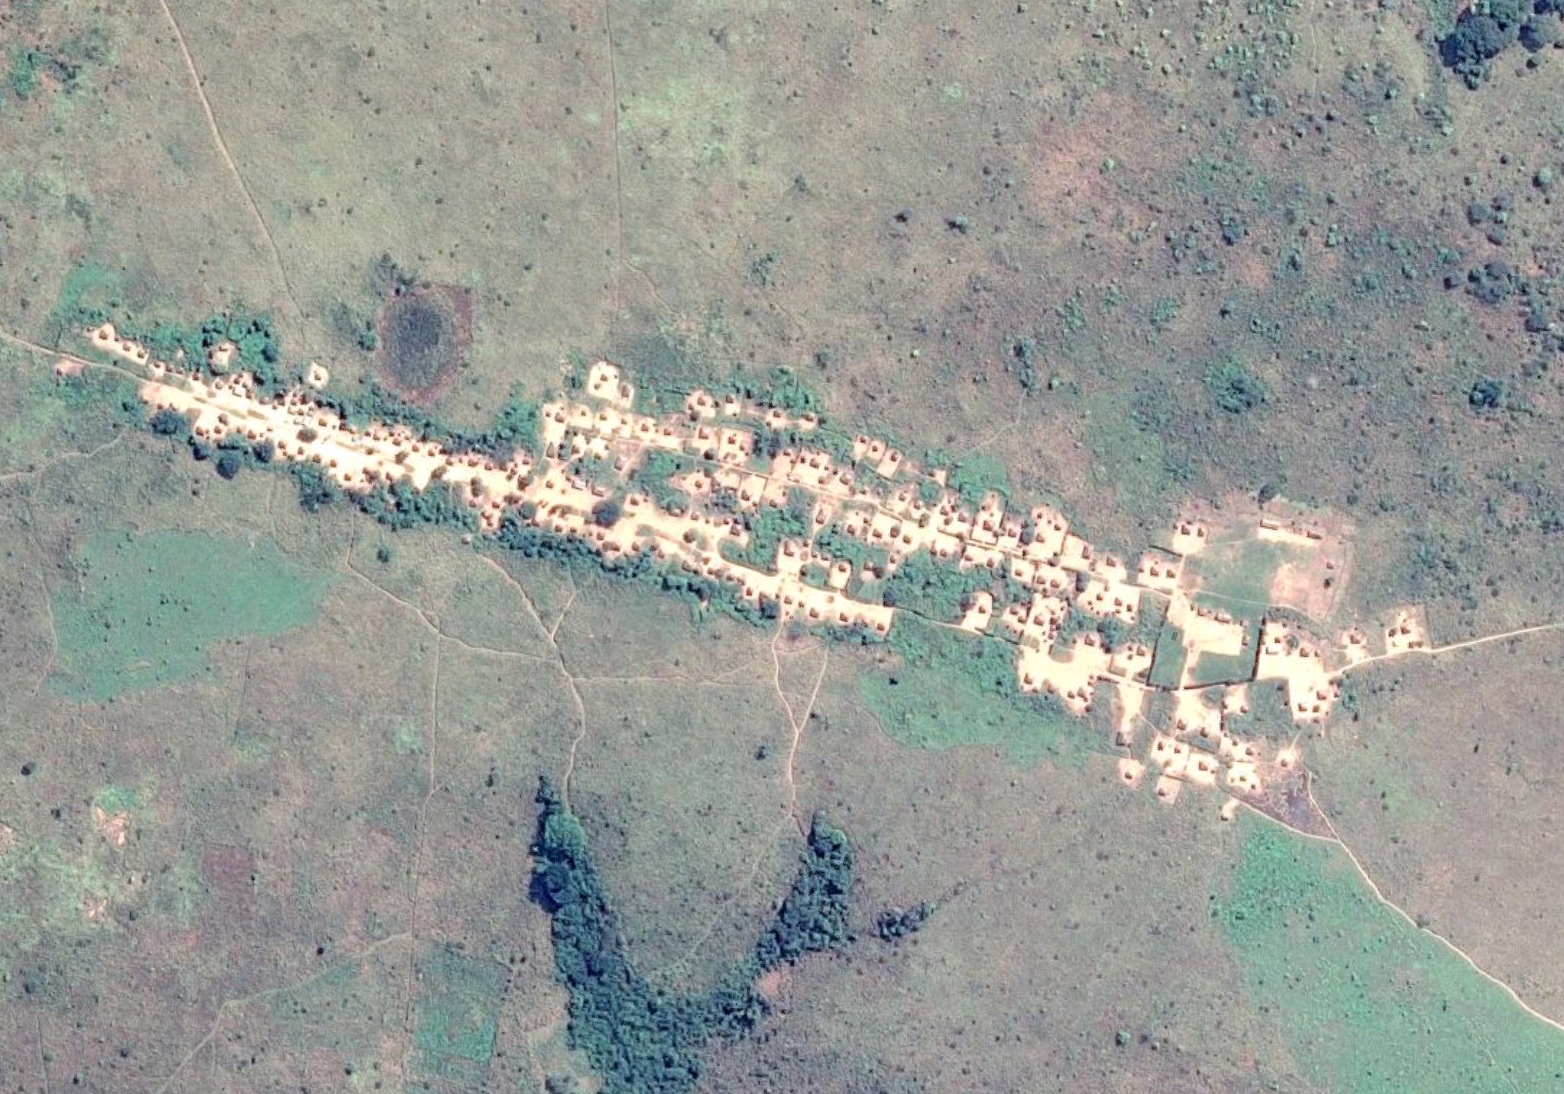
How did a large settlement in the middle of the Democratic Republic of Congo hundreds of miles from any other settlement come to be (-7.06784485139, 24.4567265231)?
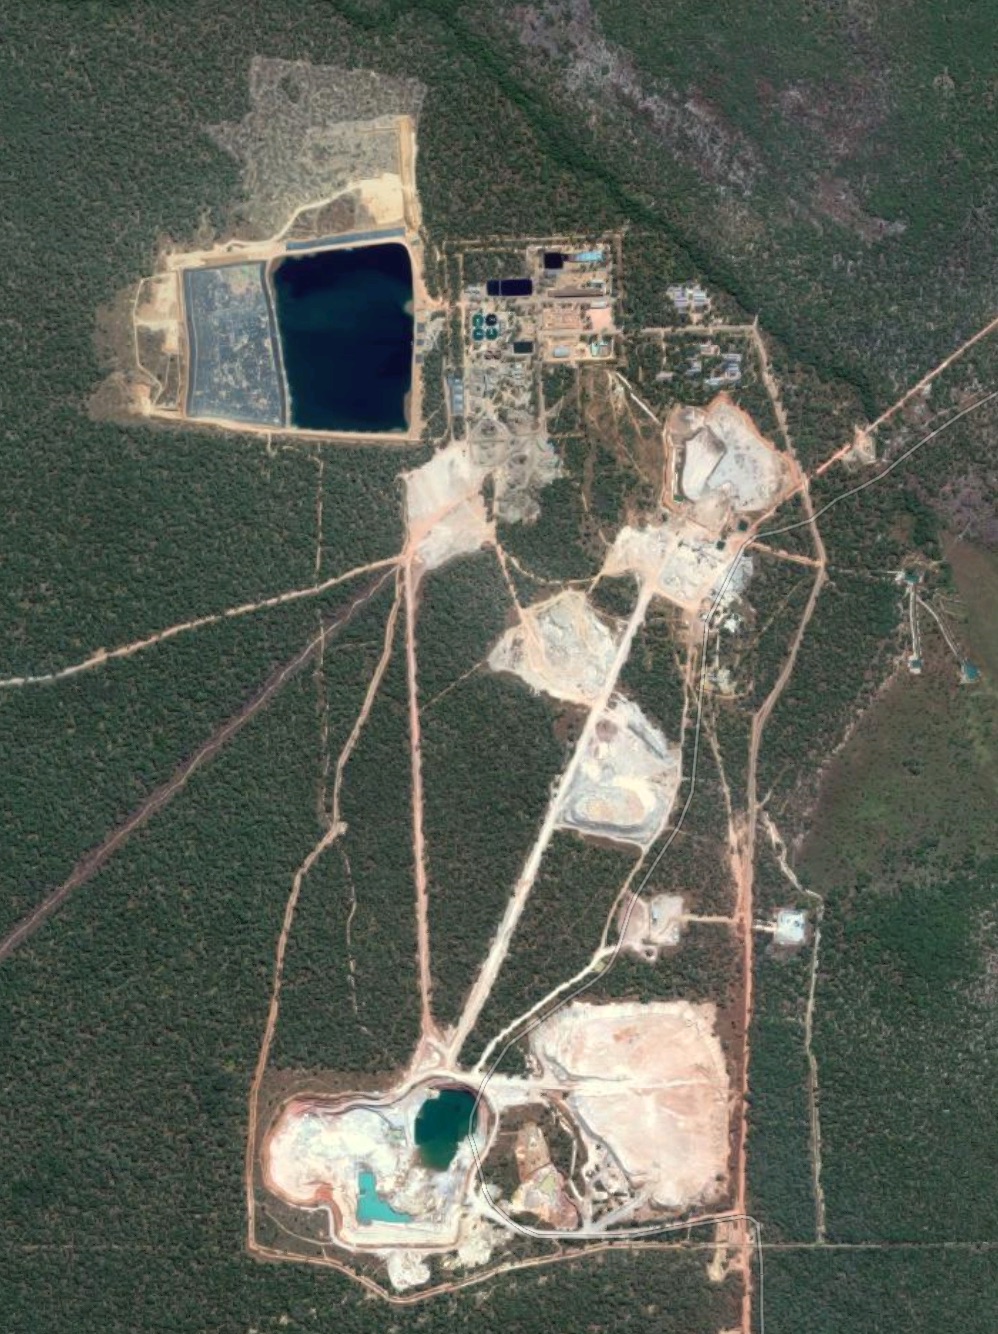
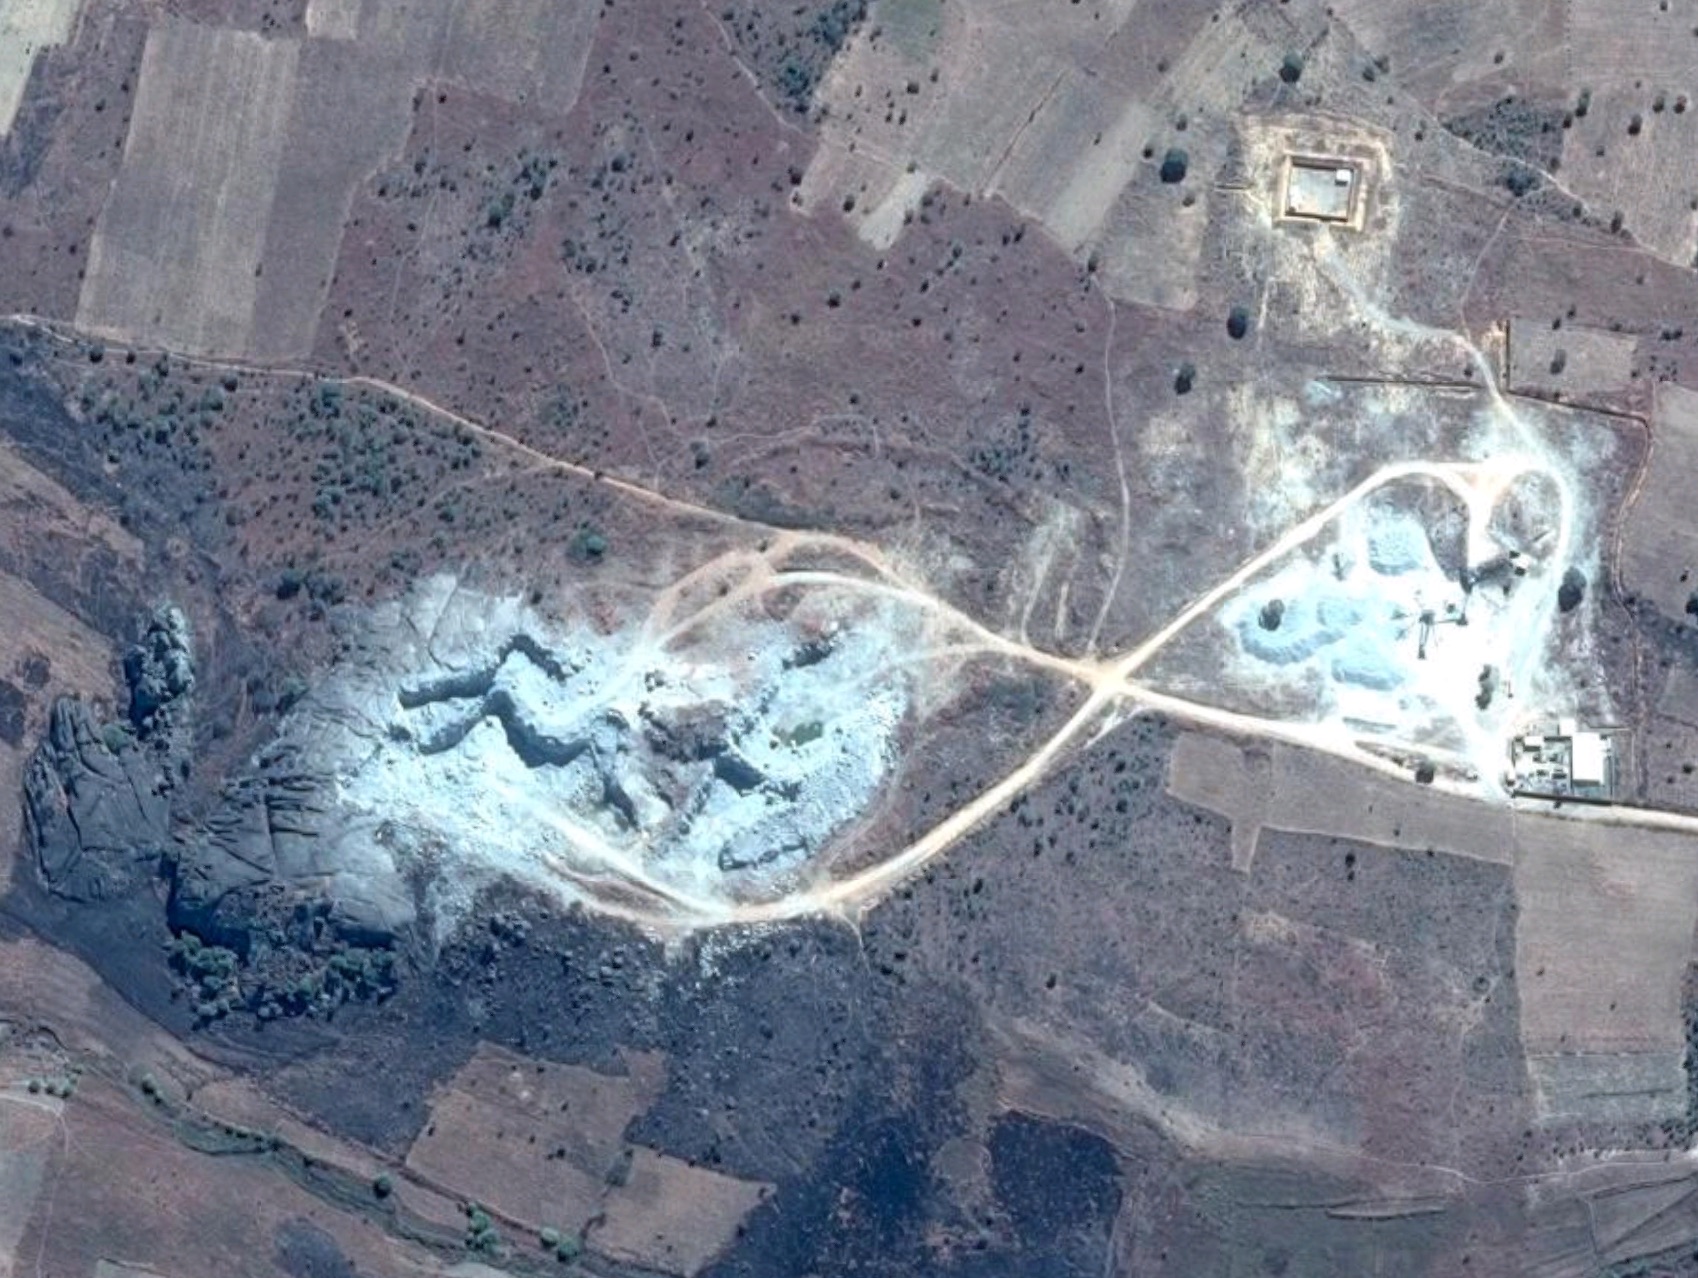
And finally, I couldn’t resist training my sights on my home state. Colorado proved to be no exception and the majority of unclassified places represented drill pads operating out in the middle of nowhere (39.6951991635, -108.115692946) like the one pictured below sitting a few dozen miles north of I-70 between Parachute and Rifle.
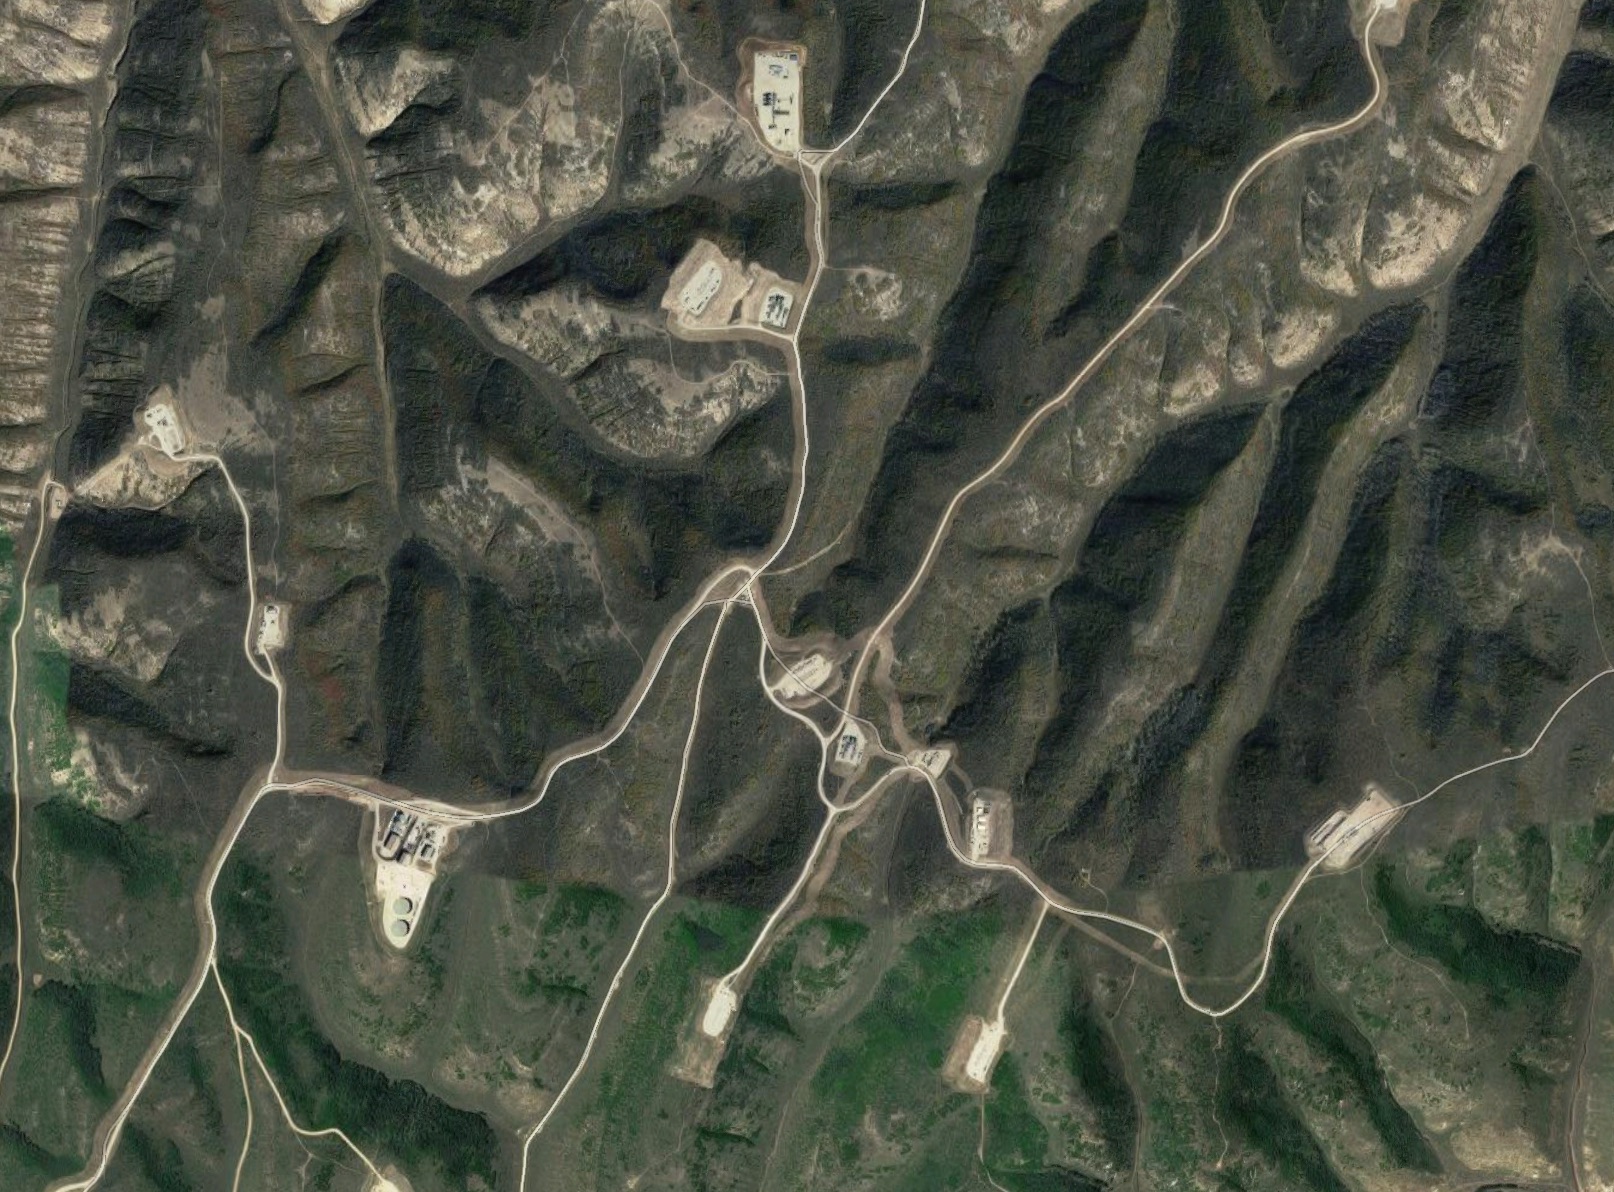
While this pass was focused on building the tool and learning whether I could extract some meaningful information about the earth from open imagery, I imagine this could be quite a useful tool at a regional level. O&G is certainly a hot issue in Colorado and periodically checking updated imagery could enable better tracking of new and expiring drill sites. While I only showed a handful of my findings, there were mysteries scattered across the globe. I hope to follow up with improved tools and new image sources. If this is interesting to you, drop me a note and I would love to brainstorm and share ideas. Check out my Colorado and Baja dual-sport routes and guide to wine country in Valle de Guadalupe for other fun mapping projects.